Capturing the Ups and Downs in Coronavirus Equity Markets

31 July 2020
3 min read
How Did Equity Factors Perform Through 2020 Volatility?
Global Factor Indices: Upside-/Downside-Capture Ratios During COVID-19 Downturn and Rebound
How Did Equity Factors Perform Through 2020 Volatility?

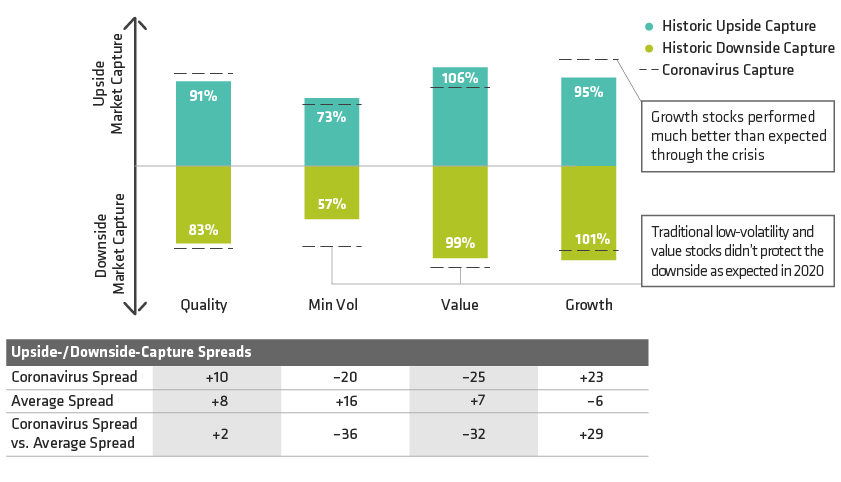
Past performance and current analysis do not guarantee future results.
As of June 30, 2020
Upside-/Downside-market capture calculated by dividing MSCI factor index return by MSCI World Index return. Average downside capture calculated using returns during the following periods. Average upside capture represents the three-month forward return from each period’s trough. Coronavirus (from February peak): February 19, 2020—March 23, 2020. Prior crises include: Rising Rates + Slowing Growth in China and Europe: September 2018—December 2018; Inflation + Fed Tightening: January 2018—March 2018; China’s Economy + Plummeting Oil Price: November 2015—February 2016; Greece + China Stock Market Crash: July 2015—September 2015; Concerns About Europe: May 2012—June 2012; Eurozone Debt Fears III: October 2011—November 2011; Eurozone Debt Fears II: May 2011—October 2011; Eurozone Debt Fears I: April 2010—May 2010; Global Financial Crisis: May 2008—March 2009; SARS: November 2002—March 2003; 2000 Tech Crash: March 2000—October 2002.
Spread is measured as upside capture minus downside capture.
Quality is represented by MSCI World Quality; Min Vol by MSCI World Minimum Volatility; Value by MSCI World Value; and Growth by MSCI World Growth.
Source: MSCI and AllianceBernstein (AB)

Several equity factors diverged significantly from their typical performance patterns during the COVID-19 crisis. By understanding how factor returns behaved in this market correction relative to their historic norms, investors can not only prepare for future volatility but also take advantage of short-term market dislocations.

Challenges to Safety Stocks

Factors, groups of stocks that target specific drivers of return across an index or market, had startling performance results during the coronavirus market disruption. Minimum Volatility (Min Vol) stocks outperformed the MSCI World Index in the sell-off though their downside protection was not as strong as usual, and their upside capture was lower than expected in the subsequent market rally. Value stocks fell further than expected and then failed to outperform during the rebound—as they typically do.

Fund Focus
ES AllianceBernstein Low Volatility Global Equity Fund

Balancing Global Equity Returns with Downside Mitigation for a Smoother Investment Journey

Capital at Risk

But Growth stocks delivered the most surprising results. This was the only factor to protect much better than expected during the downturn, and then also outperform in the bounce off the bottom.

Investors can evaluate these patterns by looking at upside/downside capture. Upside capture measures how much the factor increased relative to a rising broad market. Downside capture measures how much the factor declines relative to the falling market.

By combining these measures—upside capture minus downside capture—we can evaluate total market capture as a spread. A positive spread means the factor collects more good times than bad times, which may lead to outperformance over time. Likewise, a negative spread means the factor accumulates more bad times than good, a result that often leads to underperformance.

Comparing the spread between the upside/downside capture ratio this year to historic norms shows just how different recent performance patterns have been.

For both Min Vol and Value, the upside/downside capture spread was roughly 30% worse than average. For Min Vol stocks, the performance during the downturn was particularly surprising, as these stocks usually provide protection in a falling market. In contrast, Growth stocks posted a positive spread of 29% over average.

Unusual Circumstances Create Unusual Opportunities

COVID-19 shutdowns created an unconventional cause for the correction and may have played a hand in the unlikely sector performance results.

This time around, investors didn’t flock to the traditional relative safety of low-volatility sectors like utilities and real estate during the sell-off. Instead, they congregated in growth companies like online retail, at-home media and technology hardware and equipment—industries that benefited from the health crisis and lockdowns. The performance of the industries, both favored and slighted, contributed to the uncharacteristic upside/downside captures for the factors shown above.

No Norm Here, New or Not

Will these patterns be the new norm? Too hard to say. But the distortions may provide opportunities for investors to rebalance portfolios. Since 2013, Min Vol stocks have not been this cheap, and Growth has not been more expensive.

However, not all Growth stocks are created or valued equally. There are a wide variety of growth businesses with wildly differing valuations, so selectivity is key. And quality defensive investments currently offer some of the best risk-adjusted return potential, in our view.

The world remains an uncertain place. COVID-19 cases continue to increase, US-China tensions are high, economic ambiguity persists, not to mention the upcoming US election. Over the long term, we believe a dynamic defensive strategy can help fuel an offense during volatile market episodes.

The types of stocks that provide protection in a crisis are always changing. By finding select high-quality defensive stocks for a given crisis at reasonable prices, investors can reduce losses in a sell-off, which makes it easier to recover when markets rebound.

The views expressed herein do not constitute research, investment advice or trade recommendations and do not necessarily represent the views of all AB portfolio-management teams. Views are subject to revision over time.

MSCI makes no express or implied warranties or representations, and shall have no liability whatsoever with respect to any MSCI data contained herein.


About the Authors