What You Need to Know

Investors often think of high yield as just a component within a fixed-income allocation. But while high yield may look like other bonds, it doesn’t necessarily act like them. In fact, high yield has more in common with stocks—with one important difference: it’s much less volatile. In this paper, we demonstrate why high yield could be a replacement for some of an investor’s equity exposure.

Long-term correlation

of US high yield to S&P 500

Correlation of US high yield

to US Treasury bonds, 20 years ending 2015

High-yield bonds are

generally insensitive to interest rates.

The Case for High Yield

Today’s fixed-income landscape features a dizzying array of securities—from US Treasury bills to corporate bonds, and from asset-backed securities to catastrophe-linked bonds. On the surface, high-yield bonds seem a lot like their fixed-income relatives: they represent loans from investors to an entity, they make regular coupon payments and they commit to repay investors in full on a specific maturity date.

So, it’s not surprising that investors tend to think of high yield as part of their bond allocations. Because high yield is one of the riskiest fixed-income sectors, many investors adjust their high-yield allocations to raise or lower the overall risk in the fixed-income component of their portfolios.

Looks Are Deceiving

But even though high-yield bonds look like other bonds, they don’t necessarily act like other bonds. This insight can have important implications for how investors consider high-yield bonds in an overall portfolio context.

High-yield performance patterns, for example, don’t track those of other fixed-income sectors very closely over the long term. Looking back over 20 years, we’ve observed that US high-yield bonds have exhibited a correlation of only 0.22 to a broad universe of investment-grade bonds, and a correlation of –0.10 to US Treasury bonds, the traditional bellwethers of the US bond market. Of course, correlations aren’t constant—they fluctuate substantially over time. Based on a rolling three-year average, high yield’s correlation to US Treasuries has ranged from as low as –0.45 to as high as 0.78.

High yield’s long-term correlation to US stocks, as measured by the S&P 500, has been 0.62; its correlation to global stocks, as measured by the MSCI World Index, has been about the same: 0.66.

Why is this? High-yield bonds, like equities, are strongly linked to the business results and fundamentals of the companies they represent. And credit spreads, the extra yield that high-yield bonds offer versus similar government bonds, tend to move in the opposite direction from interest rates. This scenario makes high-yield bonds generally insensitive to interest rates—the dominant risk for many investment-grade bond sectors.

But this sensitivity isn’t constant over time. It’s typically higher when high-yield spreads are lower. Correlation during these periods is positive, although modest. When yield spreads are wider, on the other hand, the correlation is often negative.

Over more than two decades of capital-market history, high-yield bonds have nearly matched equity performance.

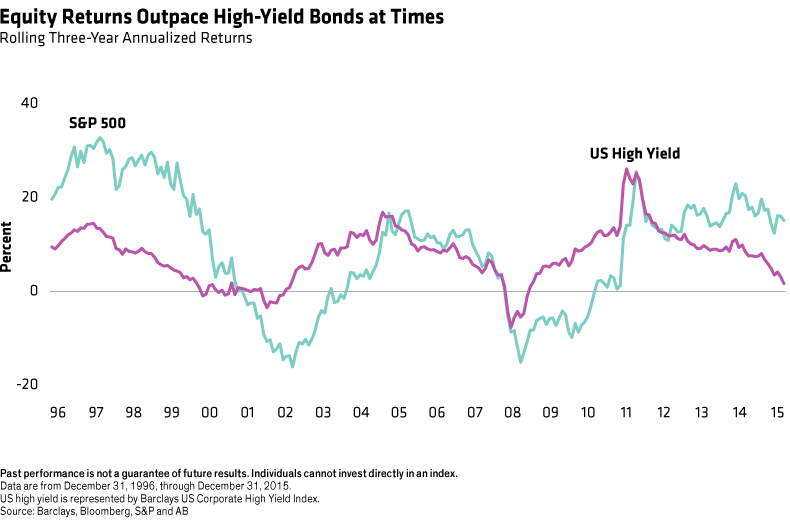
Equity Returns Outpace High-Yield Bonds at Times

Investors are paying attention to these improvements. Following the outflows in 2015, new capital has started to flow back to both stock and bond funds that focus on the developing world. Still, most global investors remain underweight, after reducing their allocation to emerging equities in recent years.

Keeping Pace with Equity Returns Over Time

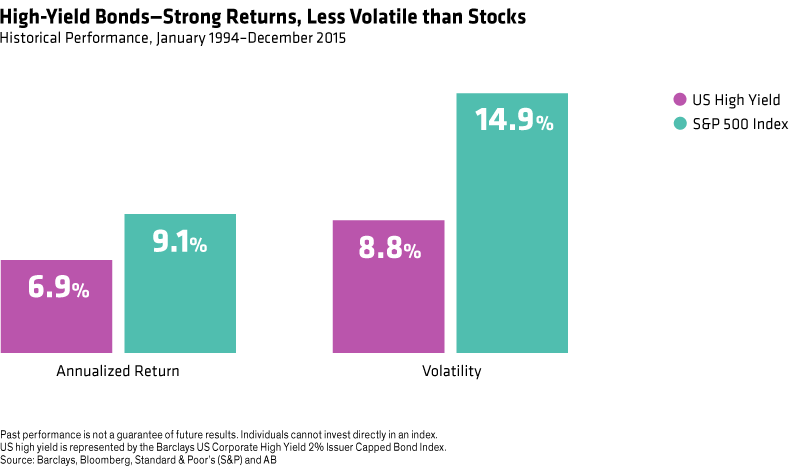
As for returns, high-yield bonds have stacked up well against equities. In fact, in over more than two decades of capital-market history, high-yield bonds have nearly matched equity performance—but with much lower volatility.

Since January 1994, stocks have produced an annualized return of 9.1%. High-yield bonds delivered a 6.9% return over that period. That’s lower than the return for equities, but still attractive, especially considering that this period spanned two full market cycles and countless rallies and sell-offs (Display below).

These two asset classes can’t be compared prior to 1983, because earlier high-yield index returns don’t exist. But the 9.1% annualized return for stocks is roughly on par with performance dating back to 1927, so these performance patterns seem fairly consistent over time.

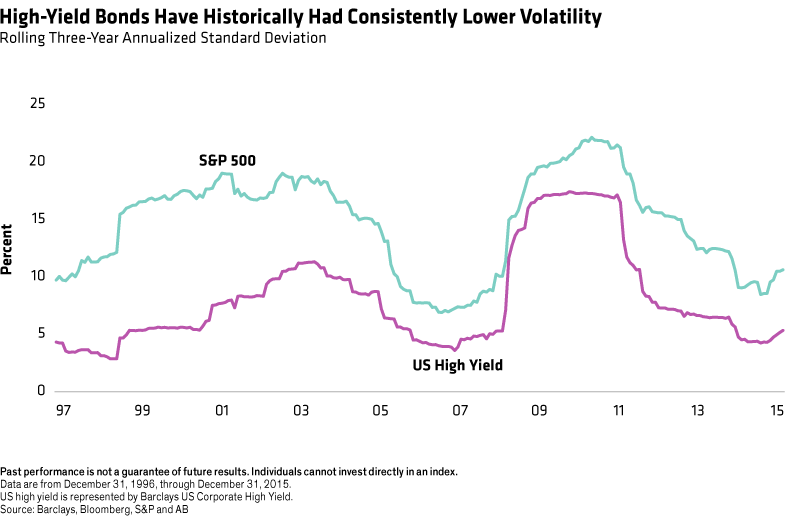
High-yield bonds haven’t always kept up with stocks—they’ve been outpaced by a good margin over certain time frames, such as when the technology/media/telecom bubble was inflating in the second half of the 1990s (Display below). But over the long haul, high yield has produced equity-like returns—with about half the risk of stocks, as measured by the standard deviation of returns.

In fact, high yield’s volatility has been lower than that of stocks (Display below), even during some tumultuous periods for capital markets. These attributes, combined with relatively low correlations to stocks and very low correlations to other bonds—have made high-yield bonds effective in a diversified portfolio.

Past performance, historical and current analyses, and expectations do not guarantee future results. There can be no assurance that any investment objectives will be achieved. The information contained here reflects the views of AllianceBernstein L.P. or its affiliates and sources it believes are reliable as of the date of this publication. AllianceBernstein L.P. makes no representations or warranties concerning the accuracy of any data. There is no guarantee that any projection, forecast or opinion in this material will be realized. Past performance does not guarantee future results. The views expressed here may change at any time after the date of this publication. This document is for informational purposes only and does not constitute investment advice. AllianceBernstein L.P. does not provide tax, legal or accounting advice. It does not take an investor’s personal investment objectives or financial situation into account; investors should discuss their individual circumstances with appropriate professionals before making any decisions. This information should not be construed as sales or marketing material or an offer or solicitation for the purchase or sale of any financial instrument, product or service sponsored by AB or its affiliates.

The views expressed herein do not constitute research, investment advice, or trade recommendations and do not necessarily represent the views of all AB portfolio-management teams.

MSCI makes no express or implied warranties or representations, and shall have no liability whatsoever with respect to any MSCI data contained herein. The MSCI data may not be further redistributed or used as a basis for other indices or any securities or financial products. This report is not approved, reviewed or produced by MSCI.

Clients Only

The content you have selected is for clients only. If you are a client, please continue to log in. You will then be able to open and read this content.