One of the key determinants for selecting the right alternatives allocation is spending. Most alternative assets are illiquid, which means they cannot be readily sold for cash. Because of this characteristic, investors need to select an alternatives allocation that does not put their spending at risk.
How Much Should I Have?
Like in the three bears fairy tale, there is an allocation that includes too much alternative assets, one that has too little, and an allocation that is just right! Of course, each investor’s circumstances are unique, and their portfolio should be individualized to reflect their wealth goals. But looking only at the returns of alternative investments and building a portfolio with the highest return profiles ignores important basic principles of investing. Portfolio construction must also take into account risk, and investing in alternative investments means considering alternative risks.
What Risks Should I Consider?
Alternatives have unique characteristics that create distinctive risks. At the whole portfolio level, risk is broken down into three areas—liquidity shortfall, allocation drift, and portfolio drawdown.
- Liquidity shortfall risk (LSR) refers to the likelihood of running out of accessible money at some point over the next 10 years. If an investor spends from a portfolio, we avoid allocations that have even a small probability of running out of cash.
- Allocation drift risk (ADR) is the degree to which asset weights drift over time. Drift will likely occur in any portfolio with illiquid investments; as the illiquid investment changes in value, it will make up an increasing or decreasing percentage of the overall portfolio. Recalibrating drift is difficult because when their weights rise, illiquid investments cannot be sold to rebalance the portfolio.
- Portfolio drawdown risk (PDR) looks at the probability that your portfolio value will fall due to market conditions. We typically model minor (5%) and major (20%) losses of portfolio value when we determine asset allocation.
Too Much, Too Little, or Just Right?
An average investor tends to spend about 3% of their portfolio per year, but spending needs are very individualized—some spend 5% or even more. That cash usage influences how much illiquid alternatives can be held in a portfolio. At a 3% spending rate, an allocation to alternatives would be higher than an allocation for a 5% spender, and significantly higher than someone who uses 7%. Why? Because the more you spend, the less capacity you have to take on illiquidity that often comes with investing in alternative investments.
Finding the balance between reaching for returns and not taking on too much risk is always the critical point at which asset allocation rests. Below we model scenarios for an investor* with a 5% annual spending requirement to show the impact of alternatives on portfolio return and risk (Display). The risk profile for a 5% spender is higher than for an individual who spends less, but the model illustrates that even a conservative allocation is beneficial.
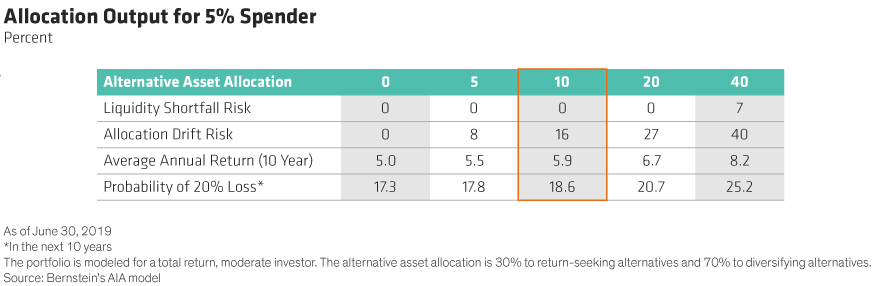
In our analysis, the investor who has no allocation to alternatives gives up 50 basis points of return each year, with a similar level of risk as someone who has just a small allocation (5%). On the other extreme, the investor that allocates 40% of their portfolio to alternative assets expects to receive an average annual return of 8.2% but has a 1 in 4 chance of losing 20% of their portfolio, and a 7% chance of running out of liquidity—risks we view as being too high to be acceptable.
The right portfolio for this investor would be an allocation of 10% to alternatives. At this level, the portfolio has no liquidity shortfall risk, acceptable (16%) drift risk, and the probability of a 20% drop over 10 years is 18.6%, just 1.3% higher than with no alternatives. At this 10% allocation, the investor’s expected average annual return is 5.9%, 90 basis points higher per year than the no allocation scenario.
Spending Drives Allocation
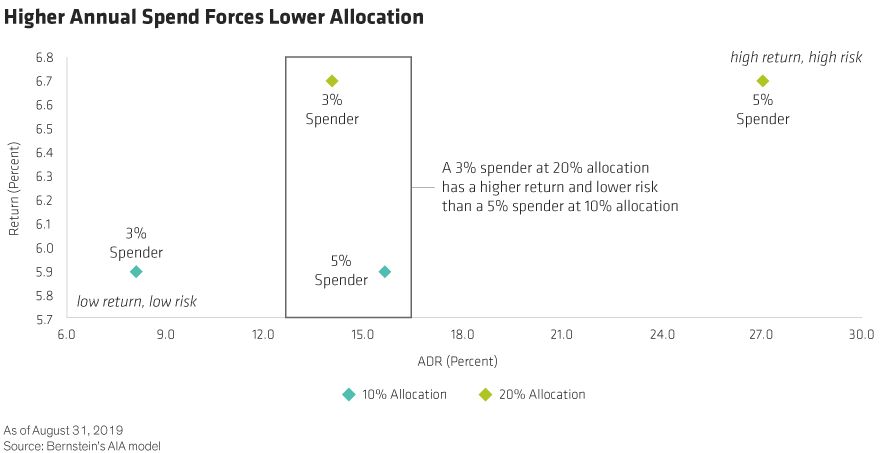
The benefits of an alternatives allocation at a 5% spend rate are obvious, and for the average 3% spender, the advantages can be even greater. An allocation to alternatives can be even higher; at a 20% allocation, the average annual return is 6.7%, with no liquidity shortfall risk and only 14% drift (Display), nearly half that for the 5% spender. So, by allocating 20% instead of 10% to alternatives, this average investor receives a higher return (80 basis points more per year) than the 5% example, with less risks—both allocation drift risk and the probability of a 20% loss are lower.
Conversely, greater spending needs may make alternatives too risky. At a 7% spend rate, for example, with even a small allocation (5%), there is a 5% chance that there will be a shortfall in liquidity.
Finding the “Just Right”
Each investor’s circumstances need to be considered to determine the optimal allocation. Being too cautious can cause you to sacrifice important returns that are difficult to come by, but being too aggressive can cause you to run out of liquidity or raise the chance of a large drawdown. Finding that balance—that right portfolio—provides the best chance to achieve the highest possible return without putting liquidity or the portfolio value at significant risk. The best of both worlds.
*Reflects a qualified purchaser
For more on trends in the economy, markets, and asset allocation for long-term investors, explore The Pulse, a Bernstein podcast series, and for additional thought leadership, check out the related blogs here.
The views expressed herein do not constitute research, investment advice, or trade recommendations and do not necessarily represent the views of all AB portfolio-management teams.