What You Need to Know

Over the last 30 years, compelling evidence has accumulated that suggests currency-hedged global bonds have a superior risk/return profile to US bonds, with more potential to add value. Global bonds have also provided better risk mitigation to US bonds and stocks during extreme downturns. In this paper, we show how hedged global may be a better way to meet an investor’s core bond objective.

Size of Barclays Global Aggregate Bond Index

Correlation of global hedged bonds to S&P 500

during extreme down months, 1987–2015

Sharpe ratio of global hedged bonds,

20 years ending Dec 2015

Reboot Your Bonds

Globalization has been a major trend in the fixed-income markets for the past three decades. Over thirty-five years ago, US Treasuries and US corporate bonds dominated the global fixed-income universe, just as bell bottoms and boom boxes ruled popular culture. But this isn’t 1978, and it’s not all about the US anymore.

Today, despite huge US deficits and massive public debt, US Treasuries represent only about one-quarter of global sovereign debt outstanding. Nearly half of outstanding global corporate credit was issued outside the US in 2015.

However, while the fixed-income markets have become global, investors have been reluctant to invest globally. US investors in particular still show a lot of home-country bias. The core bond strategy for most US-based institutional fixed-income investors remains US-centric.

In this paper, we share the results of our analysis, in which we explain not only why we believe that investors should globalize some or all of their fixed-income assets, but also whether they should hedge non-US currency exposure.

While fixed-income markets have become global, the core bond strategy for most US institutional investors remains US-centric.

The Potential Benefits of a Bigger Pond

The most obvious potential benefit to globalizing comes from a significantly increased opportunity set. The Barclays US Aggregate Bond Index as of year-end 2015 represents about $18.1 trillion in outstanding debt and about 9,700 issues. Its global counterpart, the Barclays Global Aggregate Bond Index, clocks in at about two and a half times that size: $43 trillion in outstanding debt and more than 17,100 issues. That’s a much bigger pond to fish in.

Going global in debt also diversifies an investor’s economic and interest-rate risk. A US-only investor is affected by one business cycle, one yield curve and a single monetary policy. Globally, there are many different countries, economic cycles, business cycles, monetary policies and yield curves. And although over short periods these cycles may closely align, over long periods the economic and business cycles of these countries have not been highly correlated.

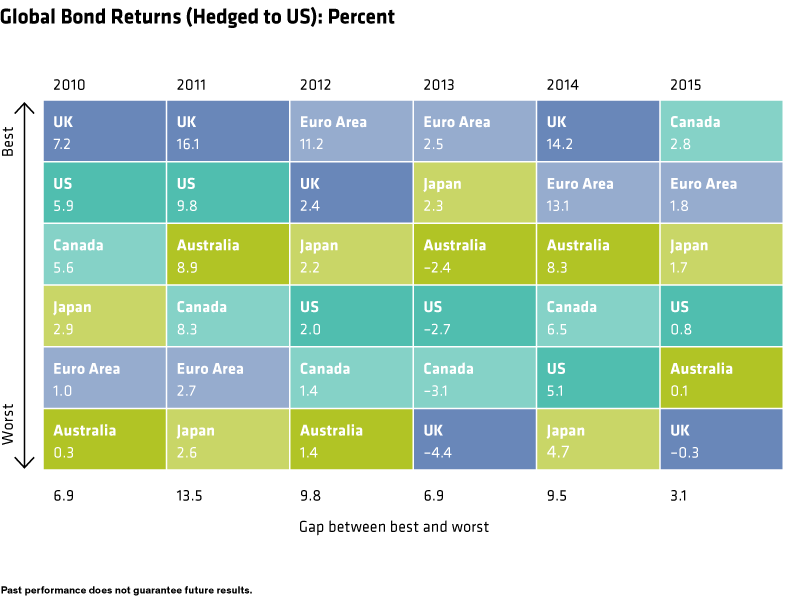
We've illustrated the potential diversification benefits of going global in the display below. This "quilt chart" shows annual hedged returns of various countries' bond markets over the past five years. (That they are hedged returns is important, because—spoiler alert—hedging will be key to our global approach in a core bond framework.)

Two features of this chart are striking. First, the array of returns, from top to bottom, differs every year. That’s because business and interest-rate cycles vary from country to country. Second, the gap—that is, the difference between the best-performing country and the worst-performing country each year—is big. For example, in 2015 Canada outperformed the UK by 3.1%.

If we were to examine the gap between the sector returns of the typical US core or core-plus option—the returns of US Treasuries, agencies, mortgages, corporates and other sectors in the US Aggregate, for example—in most years (barring the extremes of 2008 and 2009), we would see a difference of just a couple of percentage points between the best- and worst-performing sectors.

So having such a large gap between country returns provides much more potential opportunity for an active manager to add value in a global portfolio: to use research to overweight countries that are likely to perform better and to underweight countries that are likely to underperform.

Past performance, historical and current analyses, and expectations do not guarantee future results. There can be no assurance that any investment objectives will be achieved. The information contained here reflects the views of AllianceBernstein L.P. or its affiliates and sources it believes are reliable as of the date of this publication. AllianceBernstein L.P. makes no representations or warranties concerning the accuracy of any data. There is no guarantee that any projection, forecast or opinion in this material will be realized. Past performance does not guarantee future results. The views expressed here may change at any time after the date of this publication. This document is for informational purposes only and does not constitute investment advice. AllianceBernstein L.P. does not provide tax, legal or accounting advice. It does not take an investor’s personal investment objectives or financial situation into account; investors should discuss their individual circumstances with appropriate professionals before making any decisions. This information should not be construed as sales or marketing material or an offer or solicitation for the purchase or sale of any financial instrument, product or service sponsored by AB or its affiliates.

The views expressed herein do not constitute research, investment advice, or trade recommendations and do not necessarily represent the views of all AB portfolio-management teams.

MSCI makes no express or implied warranties or representations, and shall have no liability whatsoever with respect to any MSCI data contained herein. The MSCI data may not be further redistributed or used as a basis for other indices or any securities or financial products. This report is not approved, reviewed or produced by MSCI.

Clients Only

The content you have selected is for clients only. If you are a client, please continue to log in. You will then be able to open and read this content.