The severe equity sell-off has raised concerns of recession in the US economy. Continued market disorder would pose a risk to the expansion at some point, but key indicators today suggest the growth cycle is still on track.
New Orders Suggest Continued Moderate Growth
The Institute of Supply Management’s New Orders Index, which captures underlying manufacturing trends, has been a reliable leading indicator of business-cycle transitions. In fact, The Conference Board recently added new orders to its Leading Economic Index.
The New Orders Index was at 51.5 in January. That’s above the demarcation line of 50, which separates expansion from contraction, and it suggests that moderate economic growth will continue. January new business trends were very encouraging across a wide range of industries—including primary metals, plastic, chemicals, computers and electronic products, and transportation.
If recession risk were relatively high, the index would already have been well below the all-important 50 threshold for several months, and the eventual drop would be roughly 10 points below January’s level.
Positive Signal from Building Permits
Residential housing construction is one of the most important—and sensitive—sectors to the economic cycle, so data on building permits from the Census Bureau is a key part of the index of Leading Economic Index. Historically, permits tend to decline long before the economy does—sometimes as much as a year or more before.
In the fourth quarter of 2015, building permits reached their second highest point since 2007. So the signal still points to moderate growth. What’s more, the consensus among housing analysts is that building permits and overall housing starts should rise by 6% to 7% in 2016, which would provide a powerful lift to the economy.
Jobless Claims Remain Low
Historically, a large sustained rise in weekly jobless claims indicates that the pace of layoffs is starting to rise, and that there aren’t enough other labor-market opportunities—or that they’re disappearing, too.
Jobless claims remain relatively low: they’ve been below 300,000 per week for almost a year. Weekly claims would have to rise above 350,000 and stay at that higher level for at least three months before they signal a significant change in labor conditions.
Press reports of layoffs have increased in recent weeks, but so has the number of job openings, which rose by 261,000 in December to 5.61 million, the second-highest level on record. More job openings should help recently displaced workers find new work. But the numbers bear watching: companies may pull back on planned hiring if they see or expect a material change in business prospects.
Equity Sell-Off—Trouble Signal for the Economy?
We think the current equity market setback is a long overdue correction—a necessary readjustment from the Fed’s highly accommodative monetary policy that helped equity prices race far ahead of the economic cycle.
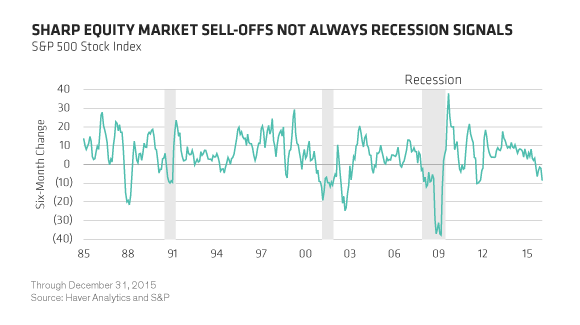
Substantial and sustained equity declines of 15% to 20% over a 12-month period have often been a precursor to economic troubles and recession. But those market declines have also been false signals, with equity declines of 15% to 20% over six-month timespans (1988 and 2002) without economic fallout (Display).
The less-than-perfect reliability may have something to do with household equity market ownership: it’s fairly narrow, and mostly concentrated in the top 10% of income groups. Ownership of residential real estate, in contrast, is much broader.
While the current selloff seems to be a market correction, continued declines would pose a risk to the economic expansion at some point.
Home Values and Equity Prices: 2016 Isn’t 2008
When asset cycles unwind abruptly, it can trigger outsize adjustments in the economy. In 2008, both home values and equity prices tanked. And a record number of households “tapped the till,” borrowing against higher housing values. So plummeting home values left many households with less wealth and more debt.
But 2016 isn’t 2008. Today’s real estate values aren’t as inflated, and they’re rising by about 5%, on average, across the US. More importantly, the share of household income earmarked for payments on financial obligations (including principal and interest payments and lease payments) is about 15% today. That’s near the lows of the past 35 years, compared to a record high of 18% in 2007.
The implication: wealth and cash positions of the average household, and its psyche, won’t be jarred anywhere near as badly as in 2008. There might be temporary pullback in high-end consumer spending, but we expect the impact to be short lived and relatively small—unless the equity downward spiral continues.
The Oil Angle: Two Sides of the Coin
Compared to past cycles, the oil-price plunge starting in mid-2014 has been larger and longer—as will the economic adjustments, both negative and positive. The high uncertainty over future oil prices creates more risk of large swings in the economic outlook, which should influence monetary policy deliberations, too.
The effect of cheap oil stretches across the US economy. A few examples: Capital spending on energy has declined. Purchases of light trucks are booming. Consumers are racking up record mileage in autos. They’re eating out and traveling more. Transportation companies are seeing lower costs.
All in all, we tend to view an energy-price decline as a net positive for the US economy over a 12- to 18-month period, although the negatives initially outweigh the positives.
The views expressed herein do not constitute research, investment advice or trade recommendations and do not necessarily represent the views of all AB portfolio-management teams.