Structured notes have gained in popularity, but investors would be wise to read the fine print carefully. Our research indicates that these complex instruments rarely live up to their intriguing claims.
Nearly $13 billion of structured notes were sold by banks in the first quarter of 2015—more than in any quarter since early 2011. It’s easy to see why. Who wouldn’t like to participate in the equity market’s upside, while protecting their portfolio from potential losses? Unfortunately, our research shows that structured notes seldom deliver the promising outcomes touted in their bold headlines.
Structured notes come in many flavors, and we analyzed the claims of several of the more popular varieties. Our analysis found that an oversimplified pitch typically obscures key constraints that adversely impact the investor’s likely final payout.
Give with the Left, Take with the Right
Consider a recent five-year structured note tied to the broad market that promises the price return of the S&P 500 Index but no loss on the first 28% cumulative drop. Buried in the disclosure are important caveats, including the lack of dividends or yield, plus a five-year waiting period for any distributions.
Those who skip the fine print might be tempted to consider this note as a potential replacement for direct stock exposure. In our view, that would be a mistake. Our analysis suggests that this structured note has an 80% chance of underperforming the S&P 500 over the next five years—and by no small amount. Using our Capital Markets Engine, we estimate the median return that investors would forego at just over 12%, as the Display below shows.
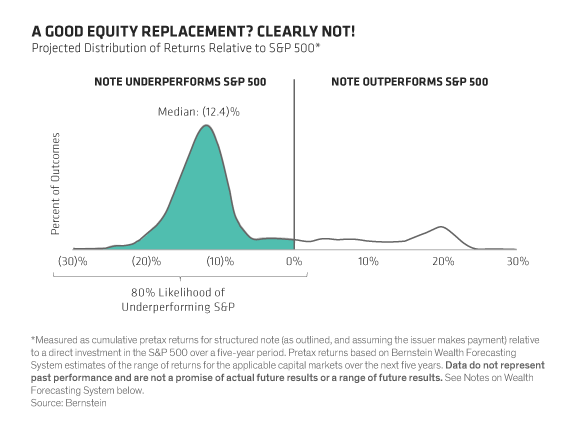
A closer look under the hood reveals why. To achieve the optimal balance between upside and downside, banks package a zero-coupon bond with options on the S&P 500. In addition to markups on the embedded bond and options, there’s a healthy sales commission, all of which reduce investors’ return potential.
Tying the note to the S&P 500’s price return—as opposed to the total return you’d receive through an S&P 500 index fund or ETF—is another drawback. The index fund includes dividends, which have historically been a meaningful portion of the broad market’s overall gains. Missing out on dividends for five years puts the note at a distinct disadvantage. It explains the lion’s share of the performance gap.
Settling for Less
Given the structured note’s mix of growth and protection, some might consider a balanced portfolio that includes globally diversified equities, municipal bonds and other diversifiers a more relevant comparison. Here again, the structured note falls short. Projecting thousands of plausible outcomes across all types of market environments, we found that the median outcome for the structured note is more than 6% below what we’d expect from a fully diversified balanced portfolio, as the next Display shows.
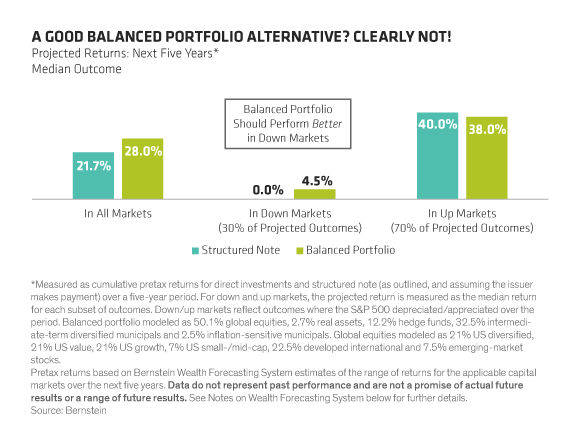
Given the sales pitch, you might expect the structured note to do better if the S&P 500 price declines over five years. Not so! In down markets, the structured note would protect you from losses up to 28%, but your expected return would be zero. By comparison, we forecast that a balanced portfolio that includes bonds and other diversifiers would have an expected return of 4.5%, with better downside protection from a deeper market drop. That’s because the income from bonds—along with their tendency to move in the opposite direction from equities—can help offset the losses from stocks, while alternatives act as a further diversifier.
In short, if investors are willing to accept no return, they are setting the bar too low. For most investors, an income-generating balanced portfolio that is both liquid and likelier to outperform represents a much better solution.
When it comes to structured notes, investors need to make sure they’re getting the full picture from their provider. We’ve assembled a few key questions to help get past the headlines. The next time someone tries to sell you skim milk masquerading as cream, ask them these questions. Chances are, you’ll end up taking your coffee black.
The views expressed herein do not constitute research, investment advice or trade recommendations and do not necessarily represent the views of all AB portfolio-management teams.
The Bernstein Wealth Forecasting System uses a Monte Carlo model that simulates 10,000 plausible paths of return for each asset class and inflation and produces a probability distribution of outcomes. The model does not draw randomly from a set of historical returns to produce estimates for the future. Instead, the forecasts (1) are based on the building blocks of asset returns, such as inflation, yields, yield spreads, stock earnings and price multiples; (2) incorporate the linkages that exist among the returns of various asset classes; (3) take into account current market conditions at the beginning of the analysis; and (4) factor in a reasonable degree of randomness and unpredictability.