What You Need to Know

Inflation has been stubbornly low, leading many to question traditional gauges like the Phillips Curve. We think the theory still works—but doesn’t tell the full story. A more holistic assessment that includes structural influences shows inflation poised to rise.

Core inflation rate in developed economies

as of November 30, 2017

The only time since 1998 that

core inflation has topped 2%

Structural inflation drivers:

demographics, globalization, populism and debt overhang

Investors face a key controversy in 2018: why has inflation stayed so low when growth is strong and unemployment falling? That’s not how the world is meant to work, and it has raised questions about the Phillips curve—a theory that links the rate of inflation (or wage growth) to spare capacity in an economy. The theory is the foundation for modern central banking.

Some argue that the Phillips curve is no longer useful and should be abandoned. Others argue that it’s still alive and well, ready to reassert itself as conditions permit (which could be quite soon). A third group thinks central banks should stick to the Phillips curve even if doesn’t work, because there’s nothing better right now. We don’t put much stock in this notion.

Inflation Doesn’t Seem Very Cyclical Today

One thing that has become very clear in recent years is that we don’t understand inflation as well as we thought. It’s certainly too complex to boil down to a simple concept like the Phillips curve. But that doesn’t mean the Phillips curve doesn’t work—it just doesn’t tell the full story. What else should investors look at to understand inflation? We think it requires both a cyclical and structural perspective.

First, though, we need to get one important fact straight: in the context of the inflation-targeting era, current inflation rates aren’t actually that low.

The best way to see this is by looking at the core inflation rate—inflation excluding food and energy prices ( Display). For major developed economies, core inflation is currently 1.4%. That’s pretty much the same as the average over the last 20 years (1.5%) and not much below the average for the 10 years before the global financial crisis (1.6%).

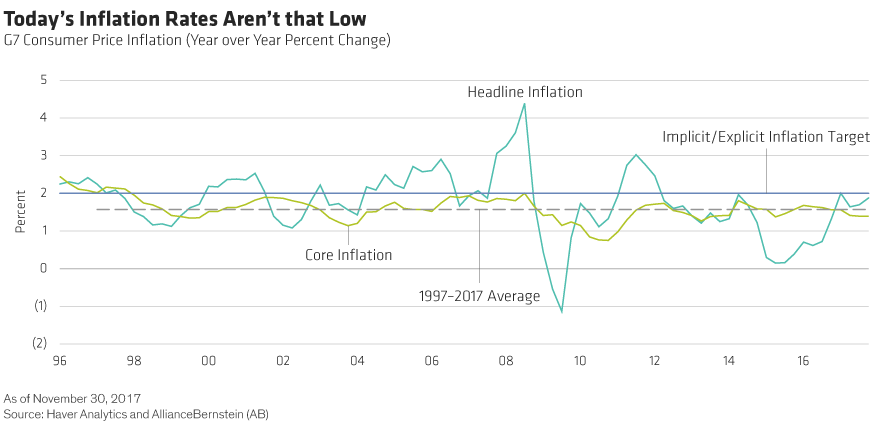
The picture is very similar for headline inflation: it’s currently 1.9%, slightly higher than the 1998–2017 average of 1.7% but the same as the pre-crisis average.

Core inflation has also been remarkably stable over the last 20 years. With two very brief exceptions, inflation excluding food and energy has fluctuated in a narrow range between 1.0% and 2.0% since January 1998 and has been above 2.0% just once (at the peak of the last cycle in August 2008). The lack of inflation volatility is all the more surprising given the large swings in economic activity during that period. All told, inflation hasn’t been very cyclical in recent years.

The Phillips Curve Isn’t Dead—But Doesn’t Tell the Whole Story

Understanding inflation requires both a cyclical and structural perspective.

Does this lack of cyclicality mean we should abandon the Phillips curve? In our view, the answer is no. We think the theory behind the Curve still makes sense—at least as a partial explanation of inflation.

And most of the evidence still broadly supports the theory. Comparing annual developed-market core inflation to the global output gap between 2000 and 2017 shows a clear positive relationship between the size of the output gap and core inflation, which is consistent with Phillips curve theory. The bigger the output gap, the higher the rate of inflation.

But the relationship isn’t particularly strong, suggesting that other factors are at play. And it takes a big change in the output gap to have a material impact on core inflation—in other words, inflation isn’t that responsive to business-cycle changes.

Past performance, historical and current analyses, and expectations do not guarantee future results. There can be no assurance that any investment objectives will be achieved. The information contained here reflects the views of AllianceBernstein L.P. or its affiliates and sources it believes are reliable as of the date of this publication. AllianceBernstein L.P. makes no representations or warranties concerning the accuracy of any data. There is no guarantee that any projection, forecast or opinion in this material will be realized. Past performance does not guarantee future results. The views expressed here may change at any time after the date of this publication. This document is for informational purposes only and does not constitute investment advice. AllianceBernstein L.P. does not provide tax, legal or accounting advice. It does not take an investor’s personal investment objectives or financial situation into account; investors should discuss their individual circumstances with appropriate professionals before making any decisions. This information should not be construed as sales or marketing material or an offer or solicitation for the purchase or sale of any financial instrument, product or service sponsored by AB or its affiliates.

The views expressed herein do not constitute research, investment advice, or trade recommendations and do not necessarily represent the views of all AB portfolio-management teams.

MSCI makes no express or implied warranties or representations, and shall have no liability whatsoever with respect to any MSCI data contained herein. The MSCI data may not be further redistributed or used as a basis for other indices or any securities or financial products. This report is not approved, reviewed or produced by MSCI.

Clients Only

The content you have selected is for clients only. If you are a client, please continue to log in. You will then be able to open and read this content.