

-
The views expressed herein do not constitute research, investment advice or trade recommendations and do not necessarily represent the views of all AB portfolio-management teams. Views are subject to revision over time.
Equity Outlook: AI, Higher Rates Raise the Bar for Diversification
02 October 2026
7 min read
Japan and US Large-Caps Led Global Gains While China, EM Underperformed

Past performance does not guarantee future results.
EM: emerging markets. *Japan represented by MSCI Japan, US large-caps represented by S&P 500, UK represented by MSCI United Kingdom Index, Australia represented by MSCI Australia Index, emerging markets represented by MSCI Emerging Markets Index, Europe ex-UK represented by MSCI Europe ex-UK Index, US small-caps represented by Russell 2000 Index and China represented by MSCI China A Index.
As of September 30, 2026. Source: FactSet, FTSE Russell, MSCI, S&P and AllianceBernstein (AB)
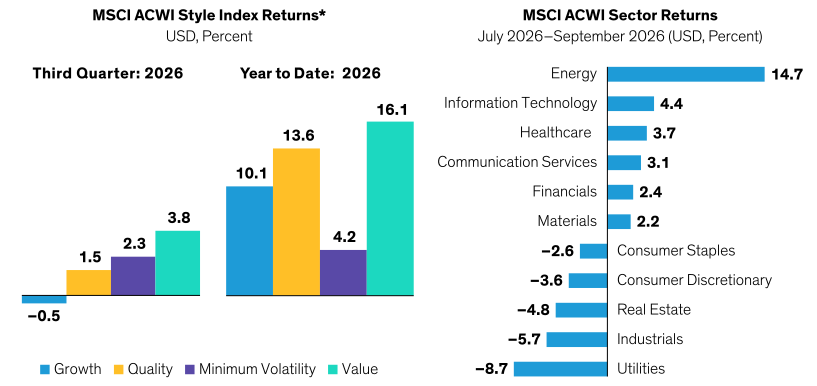
*Growth represented by the MSCI ACWI Growth Index.
Quality represented by the MSCI ACWI Quality Index. Minimum Volatility represented by the MSCI ACWI Minimum Volatility Index. Value represented by the MSCI ACWI Value Index.
As of September 30, 2026.
Source: FactSet, MSCI and AB
Tech Volatility Reaches Its Highest Since the Dot-Com Crash
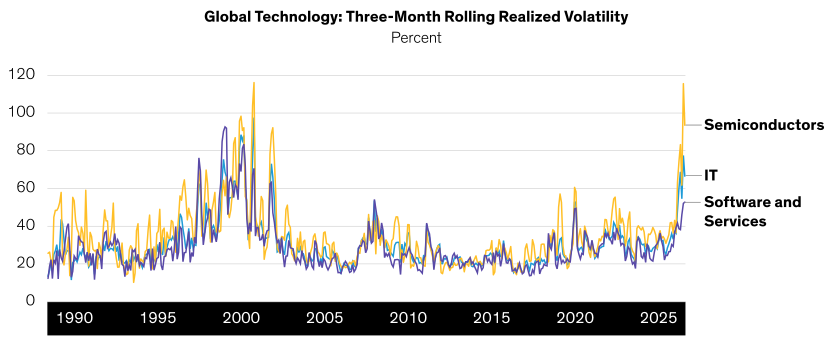
Past performance and current analysis does not guarantee future results.
Three-month rolling realized volatility from month-end prices (annualized). Market capitalization > $5 billion. Based on median company data for global industry groups.
As of August 31, 2026
Source: UBS HOLT and AllianceBernstein (AB)
AI Is Pulling More Stocks and Industries Into Its Orbit
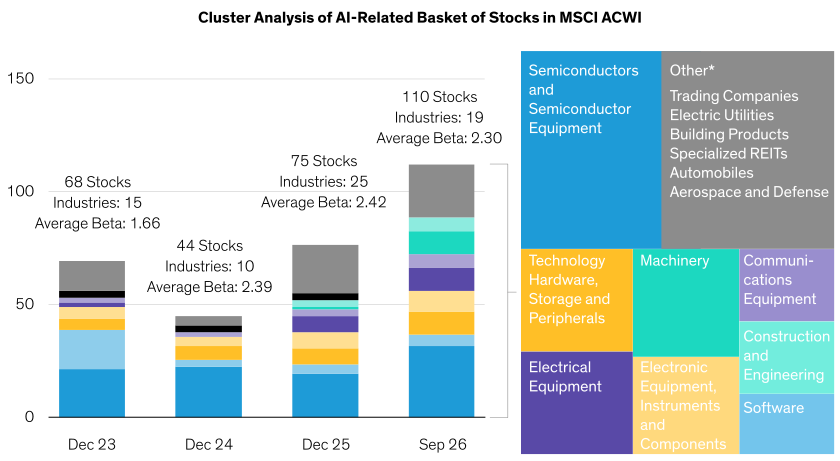
Historical analysis does not guarantee future results.
REITs: real estate investment trusts
Clusters are identified using AB’s proprietary stock-clustering framework, which groups stocks exhibiting similar trading characteristics. The AI-related cluster shown represents the principal cluster containing the largest share of AI-exposed companies in each period.
*Select industries among 11 listed in “other” category.
As of September 22, 2026
Source: Bloomberg, MSCI and AB
Which Regions and Sectors Offer Diversification to AI Exposure?

Historical analysis does not guarantee future results.
EM: emerging markets
Left display: correlation of MSCI ACWI and MSCI regional indices vs. the GS US Broad AI index. Right display: correlation of MSCI ACWI sectors indices vs. the GS US Broad AI index. The GS US Broad AI basket consists of US-listed companies that are pursuing the development of AI across all categories: hyperscalers, data center infrastructure, equipment suppliers, power and commodities.
Based on monthly returns in USD terms from January 1, 2025, through September 29, 2026.
Source: Bloomberg, MSCI and AB
-
MSCI makes no express or implied warranties or representations, and shall have no liability whatsoever with respect to any MSCI data contained herein. The MSCI data may not be further redistributed or used as a basis for other indices or any securities or financial products. This report is not approved, reviewed or produced by MSCI.
About the Authors