Additional Contributors: Robertas Stancikas, Harjaspreet Mand and Maureen Hughes
- Investors' ability to keep portfolio volatility generally low has historically rested on the ability of stocks and high-grade bonds (namely the duration element) to diversify each other.
- The transformed inflation and policy regime in the wake of the pandemic raises the question of whether that diversification can persist. Over the longer sweep of history, the stock-bond correlation has usually been positive, with the past 20 years looking like an aberration.
- In this paper we discuss the empirical and theoretical drivers of stock-bond correlations and why we think this regime will change. The first realistic prospect of higher equilibrium inflation in decades—and higher inflation volatility—fundamentally changes bonds' ability to diversify equity risk.
- Rising stock-bond correlations imply that cross-asset investors have a portfolio duration problem that has been masked until now by substantially negative stock-bond correlations.
- Recent decades have seen lower portfolio volatility brought about by negative correlations but have also seen a shifting of retirement-saving risks toward individuals. This prompts a crucial question of how individuals should think about this risk and intensifies a focus on long-run real returns.
- The change in correlation regime has sparked a hunt for new diversification sources within and beyond fixed income and will intensify the reallocation into illiquid assets. It also requires a debate on the extent to which stale prices masquerade as diversification—and creates a need to explore other diversifiers, including factors.
- We assess how large a reallocation would be required to bolster diversification if correlations were to normalize—and discuss which assets should be the destinations.
Diversification is a well-traveled topic that has become more urgent in the past few years as investors grapple with potential changes in a longstanding correlation regime and the implications for portfolio construction. We start our note with four blunt observations:
1. The past 20 years have been really abnormal
The past two decades have been an extreme outlier versus the longer run of history (Display 1). While we don't wish to get bogged down in a debate about the drivers of stock-bond correlation in the 18th century (the relevance of such history being debatable), the last 20 years have been unusual. One should not dismiss the recent past since it's the basis of most investment models. However, we worry that, in times of change, there's too much reliance on it as a guide to the future.
If the pandemic doesn't count as a regime change, we don't know what does. This is one reason why the author of this piece declared that he is "no longer a quant"—see Are We Human or Are We Dancer?. Against that backdrop, we think it's important to have a longer run of data that looks across many different economic and sociopolitical regimes. In this case, a stock-bond correlation that is closer to zero or even slightly positive seems more likely than a negative correlation.

2. If it weren't for this abnormally negative stock-bond correlation, simple multi-asset portfolios would have had significantly higher volatility.
Recent decades have witnessed the triumph of a simple 60/40 stock/bond portfolio. Indeed, this strategy has evolved from an investment heuristic to assume the mantle of a nearly passive default allocation. This is a fallacious view—it's nothing of the sort—but the 60/40 portfolio's success has allowed it to be heralded in this way. We've discussed the lower-return prognosis for such an approach elsewhere; here we will focus on its risk.
In Display 2, we show the realized volatility of a portfolio of 60% passive US equities and 40% US 10-year government bonds. We also show what its volatility would have been if the stock-bond correlation had stayed at its long-run average of the last 150 years, 0.13, instead of plunging into negative territory.
Prior to the early 2000s, the two series tracked closely. After 2001, though, as the stock-bond correlation turned negative, they diverged. As a result, the realized 60/40 volatility is substantially lower than it would have been with the historical average correlation. Over the last 10 years, the average realized volatility has been 8.2%; using the historical average correlation, volatility would have been 9.5% over the same period.

While negative correlation has kept portfolio risk lower in recent decades, there's been a contemporaneous shift in retirement-saving risks toward individuals. The reasons for the shift stem more from corporate and government policy choices than from negative stock-bond correlation. But the transition of more risk to individuals has been made easier by healthy returns from the major asset classes, and the diversification inherent in this model has guided views about what an appropriate risk measure is—views that are now entrenched.
This situation raises the crucial question of how individuals should think about this risk. Ultimately, that question can't be separated from the question of what investment time horizon should be used, which will intensify a focus on long-run real returns, with a risk measure to match. In other words, defining risk as the probability of missing an outcome rather than an observed volatility.
3. Part of the active-to-passive rotation rested on a particular set of macro circumstances.
Three reasons have driven a US$2.5 trillion net flow from active to passive equity investing over the past 12 years (Display 3). First, some active managers turned out to be index huggers in disguise and not deserving of an active fee. There has been a very significant allocation away from these managers, with fund selectors placing a lot of attention on avoiding them. Second, both stocks and bonds had beat inflation by a wide margin over this period. If we assume that inflation is the implicit benchmark for many investors, then the ample return from beta was enough to meet their needs. So, in hindsight at least, there was less need to pay for alpha with its associated agency and search costs.
The third reason is more subtle, related to the macro investment environment and not the structure of the investment industry. It's no coincidence that the active-passive rotation happened at a time when it was possible to achieve an unusually large amount of diversification by taking passive positions in the two biggest, most liquid asset classes. If both bonds and equities delivered returns well above inflation, why pay fees for active management? The possibility of declining real returns from both asset classes has raised the prospect that this simple passive approach may fail on return grounds; the prospect of a lack of diversification adds an extra challenge to that approach.
Any change in the prospects for the stock-bond correlation will force a new stage in the active/passive investing debate. We've long been asked "When is there too much passive?" We think this question is slightly misplaced. Any limits due to market efficiency or capital allocation across the economy are likely a long way off. Instead, the limit will likely come from asset owners and fund selectors when they realize that the current model is broken—with a loss of diversification being a major element.

4. Cross-asset investors have a duration problem.
We can also demonstrate the importance of this issue by showing the scale of the duration problem facing investors. The downward path of bond yields in recent decades means that the duration of a position in, say, US 10-year Treasury bonds has mechanically increased. One might think that the duration of a multi-asset portfolio that included a significant bond allocation would have increased too, but these have actually been spared.
We can show this in terms of empirical duration—the first derivative of price with respect to the change in 10-year rates (Display 4). On this basis, a large negative number is a sign of long duration in the conventional sense—an upward shift in rates would cause a negative return. The decline in the lower line in the chart (10-year rolling bond duration) shows how the duration on 10-year bonds is as extended as it's ever been. The middle line, which shows a 60/40 portfolio, shows no such change, and it has been stable for the last decade.
It turns out that a shift to strongly negative stock-bond correlations means that equity duration has effectively changed sign, offsetting the increase in bond duration. If the stock-bond correlation were to revert closer to zero, this "cushion" would be removed, with the duration of a simple multi-asset portfolio rising. This shift could boost portfolio interest-rate risk just when there's an unprecedented level of strategic uncertainty about the nature and direction of policy.

Why Is There a Risk that Correlation Rises Now?
We think a strong case can be made in the post-pandemic environment that the historically "easy" diversification of stocks and bonds may no longer be reliable. This eventuality was on display in early 2022, when stocks and bonds were positively correlated. To be clear, our focus is strategic, not tactical, but this could be a taste of things to come. Stock-bond correlation has fluctuated over short periods, but the question that concerns us here is: What average correlation level can be expected over the next decade for investors who don't want to consider rapid tactical portfolio changes in their hunt for diversifying return sources?
The key environmental change is that the post-pandemic era brings the first realistic prospect in decades of strategically higher inflation levels. Moreover, there's a case that inflation volatility will also be higher. We'll show below—both empirically and theoretically—that this outlook includes a case to act on stock-bond correlations. One can choose to question whether the outlook really is new after the pandemic, but we believe a regime change has occurred. We won't address that topic here because we've covered it elsewhere. We made the case in Assessing the Inflation Trajectory—and Portfolio Responses that equilibrium inflation will be higher, and we outlined the case for a broader permanent shift in the investment environment in Are We Human or Are We Dancer?.
Here we'll review some of the forces identified in the academic literature as being important for correlations, and then we'll show the results from our own empirical analysis.
From a theoretical perspective, stock and bond prices are driven by discount models that share common elements. They can be used as a structure to think about which forces increase and which decrease correlations between these assets. The stock and bond price equations may be written as:
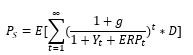
where P is the stock price, g is the expected growth rate of dividends (D), ERP is the equity risk premium, D is the starting level of dividends and Y is the government bond yield,
and
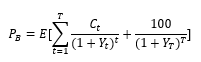
where P is the bond price, C is the bond coupon and Y is the discount rate.
Stock and bond prices represent the present values of expected future cash flows, discounted by a rate that includes relevant risk premiums. Government bonds have fixed cash flows, but stock dividends are uncertain—the expected dividend growth rate has a critical impact on valuations. Thus, while both stocks and bonds share uncertain discount rates, they have different sensitivities to macroeconomic conditions, which can turn correlation positive or negative.
Ewan Rankin and Muhummed Shah Idilat the Reserve Bank of Australia use a discounted cash flow model in their overview of the determining factors in the stock-bond correlation.1 Specifically, they focus on the impact of growth and inflation shocks and the uncertainty of these variables. Changing expectations for growth and inflation translate into forecasts for dividends and interest rates. Stronger economic growth and higher inflation lead to higher-interest-rate forecasts because tighter monetary policy is expected in the future. These conditions also lead to higher-dividend forecasts as corporate profit expectations rise.
So, the ultimate impact on the stock-bond correlation depends on how much expected dividends change relative to the discount rate. Growth shocks should have a greater positive impact on expected dividends, but only an indirect impact on interest rates, so stock prices should rise and bond prices should fall—producing negative correlation. Inflation shocks directly increase interest rates, while the positive impact on dividends might be muted (depending on the ability of firms to pass through prices). This scenario should hurt prices for both asset classes—leading to positive correlation. More uncertainty in the growth outlook will hurt stock prices as the equity risk premium rises but will benefit bond prices. More inflation uncertainty will raise both the discount factor for stocks and the term premium in bond yields, increasing correlation. Rankin and Idil's lengthy series of stock-bond correlations for the US, UK, Australia and Japan, dating back to the 1900s, demonstrates that positive correlation has been the norm for most of the 20th century, underscoring how unusual the negative correlations of the past 20 years have been.
Antti Ilmanen's analysis focuses on four key dimensions that drive stock and bond returns: the business cycle or growth outlook, the inflation environment, the volatility conditions and the monetary-policy stance.2 Based on this structure, better economic growth prospects should be positive for equities because of higher expected dividend growth, while bonds don't benefit, leading to negative correlation.
High inflation is unambiguously negative for bonds, while the impact on equities is nonlinear. With low positive inflation, discount rates are relatively stable, and a positive expected dividend growth rate should dominate, resulting in lower correlation. With high inflation, common discount-rate changes dominate both stock and bond prices, leading to positive correlation. High volatility drives a "flight to safety" from equities to government bonds, turning correlation negative. Ilmanen also shows that monetary policy easing benefits both equity and bond returns.
Ilmanen focused mainly on the US, with a brief mention of Japan and Germany, while Lieven Baele and Frederiek Van Holle extend the analysis to a sample of 10 developed markets.3 They emphasize the importance of monetary policy, showing that no matter the inflation and growth regime, correlations are always positive when monetary policy is restrictive.
Meanwhile, negative correlations are associated with periods of accommodative monetary policy—but only in periods of low inflation. Lingfeng Li, examining the G7 markets, finds a strong link between uncertainty about long-term expected inflation and the stock-bond correlation: greater inflation concerns likely lead to positive stock-bond correlation.4 The paper also finds that uncertainty about real interest rates and unexpected inflation also influence stock and bond co-movement, but to a lesser degree.
Our own empirical analysis closely matches the documented academic results. We examined the key drivers of the five-year rolling correlation of US stock and bond returns since the 1970s. In what we found to be the most parsimonious model (Display 5), the 10-year real government bond yield is the most statistically significant variable, and it captures the common discount-rate factor shared by stocks and bonds. The beta coefficient is positive—a rising discount rate is negative for both equities and bonds, driving positive correlation. The 10-year break-even rate captures the impact of inflation; as outlined above, rising inflation is negative for bond returns, and a large jump in inflation can undermine equities at the same time, so it's positively linked to the stock-bond correlation.
The negative coefficient on equity versus bond volatility captures "flight to safety" episodes, where investors choose bonds when equities see bouts of volatility. Industrial production, a proxy for the business cycle and growth expectations, is also statistically significant with a positive coefficient. The positive link to stock-bond correlation runs counter to the economic rationale, suggesting that positive growth news should cause stock and bond returns to diverge. The rationale holds that dividend growth expectations should rise, while bonds don't benefit—and might even be hurt by expectations of higher future yields. However, the coefficient is near zero, and growth expectations and the potential for future higher yields might already be partly captured by the 10-year real rate and break-even rate.
Our view is that policymakers (more politicians than central bankers) may grow more comfortable with moderately higher inflation as a way to address high debt levels. If we're correct, we would expect more accommodative policy given a certain level of inflation. As mentioned earlier, Baele and Van Holle suggest that accommodative policy is associated with a negative stock-bond correlation, but only when inflation is low. We expect longer-run inflation to settle above the historical average, so the long-run policy outlook wouldn't stop the correlation from increasing.

In Displays 6–9 (below), we show the history of the key stock-bond correlation drivers identified in our model.


The pandemic creates the possibility that we're in a different regime, so we feel that it's important to analyze correlations over a horizon that's significantly longer than "only" the last 50 years. Our data is less complete and crucially lacks a measure of inflation expectations, so we show this longer-term analysis separately. We also analyze on a univariate basis, rather than striving for a multivariate model (Display 10).
The common discount rate, proxied by the US 10-year government bond yield, is still the most statistically significant variable. Inflation and inflation volatility are also important drivers, and the "flight to safety" effect from high equity volatility is significant as well, though the coefficient is very close to zero.

Displays 11–14 (below) show the history of the most statistically significant variables plotted against the five-year rolling stock-bond correlation.


For international comparison, we also include the long-run analysis of the UK market—and we have a significantly longer data history (Display 15). The conclusions are broadly similar, with the UK 10-year government bond yield, inflation and volatility all having statistically significant impacts. However, inflation volatility in the UK is much more statistically significant, with a larger explanatory power, than in the US. Bond volatility in the UK has a strong, statistically significant impact, while it's not significant in the US.

Displays 16–19 (below) show the history of the most statistically significant variables plotted against the five-year rolling stock-bond correlation in the UK.


Applying a multivariate regression with the statistically significant variables from the univariate regressions discussed earlier, inflation volatility remains the most statistically significant variable (Display 20). The 10-year bond yield and the volatility difference between stocks and bonds also remain very significant statistically, while the level of inflation is borderline significant.

A Three-Way Trade-Off: Time Horizon, Diversification and Cost
For decades, a long-duration position has played many roles in a portfolio—including serving as a source of income and as a diversifier for higher-risk assets. Both of these functions are now moot, leading to the question of what diversification is exactly. This topic needs to be discussed and is inextricably linked to time horizon; in fact, the entire question of how to measure risk is inseparable from time horizon, though the industry may have lost sight of this point in the explosion of benchmarking (a topic for future research).
Strategies that are effective at reducing the effect of abrupt short-term losses aren't necessarily the same as those that offer a diversifying return stream over decades-long periods. We can show this as a three-way trade-off (Display 21) between income (cost), drawdown mitigation and diversification. Investors' location on the axis between diversification and drawdown protection is determined by their time horizon and sensitivity to short-term losses.
The main focus of this note is for longer-term investors, so in the following sections we will delve into longer-term diversification. In this context, the income/cost parameter is net-of-fee return. This number can range from highly positive for an asset whose income exceeds fees by a wide margin, but it can also be negative. An example would be strategies that provide an insurance-like return of protection at critical times but that are otherwise a net cost.
In the past, high-grade bonds could perform all these functions while also providing an income stream rather than imposing a cost. They may still have a role to play in reducing drawdowns, but if they no longer fulfill the other two roles, we suggest a few other options by way of illustration (in blue) that are available to investors. Bonds have played these various roles so effectively for so long that it may take more time until a broad swath of investors accept that they need to think about this three-way trade-off in a new light.

We can separate these roles in a portfolio by looking at the trade-off between 1) income and long-run diversification; and 2) between income and drawdown protection. In Display 22, we show the annualized net return of strategies plotted against their correlations with US equities. Because this note is for long-horizon investors, we measure net returns and correlations with equities since 1990.
High-grade fixed income (represented by 10-year US Treasury bonds) has played a special role in this context. Over the past three decades, it's been the only return stream that meaningfully falls in the top left quadrant—delivering positive income and an outright negative correlation with stocks. The dotted arrow indicates where we think 10-year bonds will move over the next decade. That point might be obvious, but we think presenting it this way makes it clearer how other options fit into the dynamic.
Gold is the asset closest to the historical behavior of 10-year bonds, with a positive nominal annualized return and zero correlation to US equities over the past three decades. We've made the case elsewhere that we think gold's real performance has been slightly positive over the very long run, and that there's a case for it to outpace a 60/40 portfolio over the next decade, given starting bond yields and equity valuations. More important is the historical evidence suggesting that gold's zero correlation with equities is robust at different inflation levels, as opposed to bonds. Treasury Inflation-Protected Securities (TIPS) have also demonstrated low correlation to US equities with a higher nominal return than gold, but as they are one of the most expensive inflation hedges right now, their future return outlook could be lower than gold's.
Illiquid assets have constituted a larger share of institutional portfolios in recent years, mainly given their higher expected returns, but they could also be useful in the search for diversifying assets. One caveat: some of the diversification of these illiquid assets is "fake"; over short time horizons, an apparently low correlation between listed and nonlisted assets could simply be an artifact of mark-to-market frequency. The useful aspect of diversification stems from the underlying distinctive nature of the return stream—if, for example, it involves encouraging corporate change (as in the case of private equity) or is not as fundamentally connected to the business cycle (as in the case of farmland).
Based on quarterly returns since 1990 (Display 22), private equity's historical performance seems very attractive, but as we've shown in our recent research on illiquid assets, we think the build-up of dry powder with consequently higher buyout multiples and a potentially less supportive path of credit yields implies much lower future returns. To be fair, high multiples are present in nearly all asset classes—driving our view of lower nominal returns. However, in the case of private equity, they could erode most of the post-fee advantage over public equity.
Two assets stand out as potentially very attractive on this basis: farmland and timberland. If our prognosis regarding the income/diversification trade-off for bonds and private equity is correct, of the assets shown here, these two are in very advantageous positions. We recently pointed out that farmland and timberland are important because they lie at the intersection of inflation-protecting assets and ESG. We've also shown that they've consistently delivered positive real returns in high-inflation periods. And unlike private equity, the fundamentals of farmland and timberland are less likely to be tied to the business cycle, as public equities are.
Factor strategies could also play an important role. We show two long/short factor strategies with outright negative correlations to equities, although with negative post-fee returns. We also include long-only strategies, such as equity low volatility and equity dividend yield, which have a less-than-perfect correlation with equities and positive income streams. We highlight these two to show the distinct risk/return space they occupy. We think such strategies are an important part of the response to lower real returns and less diversification, as we outlined in Asset Classes and Factors: What's the Difference?.

The other trade-off in our three-way distinction is for investors who are more sensitive to short-term losses. They can't avoid a shorter time horizon, which results in an inescapable trade-off between income (cost) and protection against risk-asset drawdowns. Digging deeper, we show the trade-off between after-fee returns and drawdown mitigation for a range of strategies (Display 23), comparing annualized returns after fees with asset-class performance during the 10 largest US equity drawdowns since 1990. The conclusion is similar to that in Display 22, which showed net return versus equity diversification potential.
Over the past 30-plus years, US government bonds have been the best asset for providing protection during US equity drawdowns and for delivering a solid nominal net-of-fee return. Gold and US TIPS are the closest to government bonds for drawdown mitigation. US private equity also shows very favorably, with high net-of-fee returns and a small drawdown, though some of this advantage over public markets is overstated because of mark-to-market frequency and the policies in determining illiquid asset values. We also add option strategies to the list of assets for drawdown mitigation, as they provide strong protection against losses but at a relatively high cost, with a negative annualized return.

One notion this analysis reinforces is what we've described as the conundrum facing investors—that the current model seems likely to lead to declining real returns (see Alpha, Beta and Inflation: An Outlook for Asset Owners). Our analysis also confirms that no single asset can replace high-grade bonds; instead, a portfolio of assets is needed, a case we've made before (see the chapter "An Urgent Need to Replace Fixed Income" in A New Paradigm for Investing, Bernstein Research, April 2020).
What This Means for Portfolio Construction
What should investors do about the prospect of higher stock-bond correlations when considering their portfolio allocations?
In Display 24, we show how the correlations of various assets with equities have evolved at various inflation ranges, highlighting the 2%–4% inflation range, our expected inflation equilibrium. The key for investors is to find assets with a stable and low correlation as inflation rises. In the fixed-income section, we show how the correlation of US 10-year government bonds with equities turns positive in a moderately higher inflation regime. US investment-grade corporate bonds and TIPS still offer diversifying power, though even their correlation with equities tends to rise with inflation. Global high-yield bonds, however, still provide diversification, as do Japanese bonds.
Real assets become a very important diversifier as inflation rises.5 The correlation of oil with equities flips from positive to negative, in part because of the 1970s experience, when oil was the main source of inflation. The world is very different now, but even outside of that period, evidence remains that oil can diversify equity risk, so we think this result remains valid. ESG constraints are the more immediate limiting factor in our view, though we think those constraints may ease over time as the nature of ESG investing—and what counts as commodity investing—evolves.6
Real estate's overall correlation with equities remains low as inflation rises, while the correlation of real estate investment trusts (REITs) with equities increases as inflation rises. This revives the long-standing question of whether the difference between REITs and direct, broader real estate investment is fundamental or just an artifact of how often prices are updated. Studies have shown that the correlation of REITs with direct real estate increases as the time horizon of return sampling increases, implying that the frequency of price updates plays a role.7
However, the correlation isn't perfect, even over longer time horizons. Fundamentally, the income stream from rents is a function of the real economy and therefore inflation, though the timing isn't perfect because rent-review cycles may be slower than changes in the inflation rate. However, REITs do have an important role to play over strategic horizons as real assets with a correlation to equities (even if an imperfect one), making them useful in diversification.
Crucially, gold has a near-zero correlation with equities even as inflation rises, so even if gold's long-run expected real return is close to zero, the asset's diversification potential means it may play a larger role in portfolios. This potential also may point to a strategic diversification role for cryptocurrencies, another zero-duration nonfiat asset (see Inigo Fraser Jenkins and Alla Harmsworth, 1Q:2022 Strategic Investment Outlook: Four Strategic Allocation Issues for Asset Owners in 2022).
Factor return streams—across asset classes—play a key role in diversification, especially when defined on a long/short basis. Factors such as equity low volatility have the potential to become better diversifiers as inflation rises, while momentum and value factors in both equities and fixed income can still deliver return streams with very low correlation to equity beta, regardless of inflation level.
Equity sectors tend to have a high absolute correlation to equities overall, but the relative performance of some sectors tends to have a negative correlation at higher inflation levels. Two categories of sectors stand out here—those that are the listed vehicles for real asset exposure (e.g., energy and real estate) and those with a more stable or lower beta profile (e.g., consumer staples, insurance and utilities).

The Question of Return Stability
This discussion raises the question of confidence in the durability of the relationships between financial variables. This note is predicated on the idea that the pandemic has heralded a regime change. If high-grade bonds can no longer diversify, can investors be confident in the other potential diversifying relationships we present? There are broader considerations around the extent to which the post-pandemic world constitutes a new set of economic rules, which we discussed more broadly in Are We Human or Are We Dancer?. However, we can highlight a few specific cases.
There's at least a normative case that real assets like real estate, farmland and timberland should continue to diversify, since their income streams are predicated on interactions in the real economy. In our recent note on ESG and inflation, The Intimate Linkage of ESG and Inflation: ESG and the Hegelian Dialectic, we highlighted a risk that financializing residential real estate could elicit a backlash, given that it's linked to broader social questions of fairness and inequality. That's a danger to monitor, but perhaps more as a longer-run concern, and it would be unlikely to completely undermine the ability, say, of rents to respond to inflation in the coming years.
The role of factor returns may be more pressing in this regard. These returns have been subpar over the last decade (Display 25), partly due to the value factor's travails, but it's also broader than that. However, this isn't the first prolonged period of underperformance, so we think this is more likely cyclical than structural—a case we detailed in Asset Classes and Factors: What's the Difference?.

How Much Reallocation Would Offset a Higher Stock-Bond Correlation?
It's hard to give a one-size-fits-all answer to the question of how large a reallocation would be needed to offset the impact of a higher correlation between stocks and high-grade bonds.
The response depends on an institution's investment goals, its ability to buy different kinds of return streams, its sensitivity to overall portfolio risk and its investment time frame. If the stock-bond correlation returned to some kind of long-run average, there would clearly be other sizable shifts in the expected returns and asset correlations. It would be artificial from a portfolio allocation perspective to consider this change in isolation, but it can be useful as a scaling exercise.
One approach would be to consider how much the portfolio duration would need to change overall to make up for the increase in duration due to a different stock-bond relationship. As we showed in Display 1, the deeply negative correlation between stocks and bonds has kept the empirical duration of a 60/40 portfolio stable at near zero, despite a rising bond duration in recent years. If the stock-bond correlation were to shift to zero, and if we assume (for argument's sake) that nothing else has changed, the 60/40's empirical duration would change to (3.6). Given the scale of adjustment necessary, an overall portfolio solution is likely needed, rather than a single adjustment in the holdings of one asset class.
Another scaling exercise considers the role of individual assets on a univariate basis. Take, for example, the role of directly held real estate. If one assumes, for the purposes of argument, that its stated volatility is real (another debate entirely), one could ask how large an allocation would be needed to make up for the reduced diversifying role of high-grade bonds. For a 60/40 portfolio to correct for higher portfolio volatility if the equity-bond correlation were to rise to zero, based on historical covariance and variance, a 12% allocation out of fixed income into real estate could in theory correct for this, ceteris paribus. This exercise assumes that inflation is in a "moderate" 2%–4% range, an environment in which real estate has been a helpful return source.
However, such a simple substitution wouldn't work for many return streams. For example, the low-volatility equity factor looks like an excellent portfolio addition to maintain diversification, given its return and ability to maintain a low correlation with equities at a higher inflation level (especially when a stable level has been reached; this ability is reduced when inflation expectations are rising). The low-volatility equity factor can make up for the reduced diversification from bonds at higher inflation, but its absolute volatility level is higher than that of bonds, so it can't simply be added to a portfolio at a given weight to reduce overall volatility. This issue doesn't mean the substitution is misguided; it simply shows that a broader conversation is needed about the trade-off between real income and risk levels.
In our conversations with investors, we often hear illiquid assets cited as an important—indeed, almost inescapable—part of the response to any reduction in diversification. The issue with this view is that some part of the face-value low correlation between many illiquid assets and equities stems from the smoothing inherent in stale prices. Stale prices aren't diversification: a high allocation to illiquid assets would likely result from a simple mean-variance optimization, but a lack of liquidity implies that allocations should be penalized if they endanger capital availability. There's no single definitive answer to this quandary, but our working assumption in such cases is that the correlation of an illiquid asset with equities is between the (often low) number implied by smoothed stated prices and a higher number, which would be the correlation of the most similar liquid asset.
The bottom line: for many investors, the desire to maintain a given level of real return leaves no choice but for risk—measured as realized volatility—to rise. The real strategic debate lies in the tension between two kinds of risk: risk measured as volatility and risk measured as the probability of a significantly lower payout for beneficiaries.
Macro Implications for Savings Rates
The main conclusions from this note relate to portfolio allocations, but we want to point out macro implications too. There could be something of a "feedback" effect of reduced equity-bond diversification on the macro economy. We've made the case elsewhere (see A Cross-Asset View of Equities) that in economies such as the US and UK, where individuals bear a lot of the risk for retirement saving, falling nominal investment returns and rising inflation requires more saving.
The vast bulk of this saving is in public equities and debt. While a shift in correlations between these asset classes doesn't affect the mean expected return, it very much affects the distribution of returns. We think the most important feature of this result is that a higher stock-bond correlation increases the risk of a hardship outcome, with benefits ending up materially below their expected levels.
In Display 26, we show the change in annual salary contribution required to reduce the risk of a hardship outcome and how that required change varies with correlations. Given the assumptions in this analysis, an increase in the stock-bond correlation from (0.5) to 0.2 would necessitate an additional annual contribution of 1% of salary to keep the probability of a hardship outcome from rising above 10%. This assumes that retirement savings are 100% invested in passive equity and bond positions.
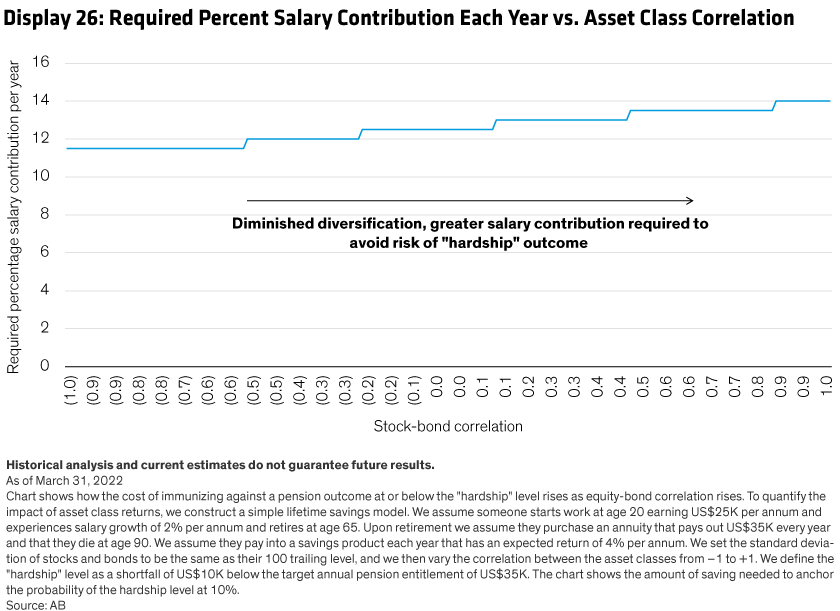
A required savings-rate increase of this magnitude is significant, given the likelihood of higher rates ahead (Display 27); it would also add to any increase in savings rates due to lower expected real returns. Savings rates were very volatile during the pandemic, as consumers were unable to spend. If we ignore that discontinuity in the series, there was a long decline in savings rates over the entire period of strong capital market returns from 1980 up to the global financial crisis (GFC). The savings rate has risen slightly since the GFC, but we see pressure for it to increase further.
Such a change would likely happen slowly, but upward pressure on savings rates over the next decade would put downward pressure on the velocity of money, which we view as one of the long-term deflationary forces (along with automation) that's likely to keep strategic inflation expectations from becoming unanchored. This view implies lower interest rates for a given level of inflation—again, focused on a strategic horizon rather than the Fed's near-term preoccupations.

Conclusion
It would be hard to overstate the importance of negative stock-bond correlations in recent years as an underpinning of how people think about investing. Its influence goes beyond specific allocation decisions, such as the apparent attractiveness of the 60/40 portfolio and the (mistaken) belief that this construct represents a passive or default approach to asset allocation. The ample diversification provided by negative stock-bond correlations has also shielded investors from a growing interest-rate sensitivity in portfolios, driven by declining yields, and has been a significant, if latent and subtle, force driving the reallocation from active to passive.
The changed post-pandemic outlook, particularly the different narrative on the likely level and volatility of inflation, challenges this status quo. We argue that investors should expect the correlation of equity and high-grade bond returns to be closer to zero—perhaps even closer to the moderately positive multi-century historical average.
We expect equilibrium inflation to be definitively higher over the next decade than it was pre-pandemic. In the US, we would forecast inflation near 3%. This is above the Fed's target, but there's potential flexibility indicated in the central bank's discussion of "averaging" inflation over long periods. Regardless, we think this level is plausible, because governments might need higher inflation to deal with debt levels (see Are We Human or Are We Dancer?). Moreover, we see higher inflation volatility ahead—as we move away from a technocratic and (semi) rules-driven approach to managing inflation, run by central bankers, to a world where fiscal policy inevitably plays a larger role. This evolution makes strategic inflation forecasts more prone to being affected by election cycles and the whims of politicians.
We never want to shy away from making normative statements in our research, so what should investors do about this issue? The first conclusion is that the risk of a rising stock-bond correlation means there is even less reason to own high-grade fixed income. Yes, starting bond yields have risen a lot in recent months, but the likelihood of a negative real return remains. If these assets are less effective at diversifying equity risk, it poses even more of a problem.
Recent years have seen a hunt for returns move down the fixed-income quality curve and also into illiquid assets for many investors. We think the hunt for diversification will come to play an equally important role as the hunt for returns, raising profound methodological and governance questions as to how diversifying illiquid assets really are. These questions may only be answered if investors address their true time-horizon needs and ensure that their governance for internal or external management is consistent with that horizon.
An outlook of moderate inflation and low real yields implies that equities will have to do a significant part of the "heavy lifting" in portfolios over a strategic horizon. Diversifying portfolio risk will likely require a significant reallocation for portfolios that had been relying on the stock-bond dynamic as the key engine for diversification. The exact form of this reallocation will depend on investors' individual risk profiles, but at the margin it will increase the need for non-high-grade bonds and assets such as factor strategies across asset classes, illiquid assets and real estate. Gold could play a role: its 150-year real return is barely above zero, but its crucial attribute—a lack of correlation with equities—doesn't change with inflation levels.
We think this topic also encroaches on the active versus passive debate. The rotation within public markets from active to passive has further to go, but even aside from considerations about the relative role of alpha and beta in a world where the return from beta is set to decline, the quest for diversification should increase interest in the role of idiosyncratic alpha in portfolios.
But what if this outlook is all wrong?
Determining the long-run forces driving the correlation of stocks and bonds is hard. What if, despite a change in inflation levels, the stock-bond correlation remains deeply negative? We could be overstating the likelihood of a change in the policy environment. Luckily, the call to action from our correlation forecast is directionally additive to our outlook based on a broader range of considerations; it's not a unique consideration. The need to make specific portfolio changes (less high-grade fixed income and more illiquid assets and factor risk) is a view we arrived at both from a return standpoint and from concerns about correlation levels.
1 Ewan Rankin and Muhummed Shah Idil, "A Century of Stock Bond Correlations," Reserve Bank of Australia Bulletin (September 2014), https://www.rba.gov.au/publications/bulletin/2014/sep/pdf/bu-0914-8.pdf
2 Antti Ilmanen, "Stock-Bond Correlations," Journal of Fixed Income 13, no. 2 (2003).
3 Lieven Baele and Frederiek Van Holle, "Stock-Bond Correlations, Macroeconomic Regimes and Monetary Policy," October 2017, https://papers.ssrn.com/sol3/papers.cfm?abstract_id=3075816.
4 Lingfeng Li, "Macroeconomic Factors and the Correlation of Stock and Bond Returns," Yale ICF Working Paper No. 02-46, November 2002, https://papers.ssrn.com/sol3/papers.cfm?abstract_id=363641.
5 Infrastructure shows up in these tables as a positive correlation, but here we are using a proxy in the form of listed equity assets, so we think that biasesthe results for these purposes.
6 Since 1980 the average correlation of US equities and oil prices has been (0.05) in years when the 10-year break-even rate was higher than 3%.
7 See, for example, Andrew Ang, Asset Management: A Systematic Approach to Factor Investing (Oxford University Press, 2014): 378.
For Investment Professional use only. Not for inspection by, distribution or quotation to, the general public.
The value of an investment can go down as well as up, and investors may not get back the full amount they invested. Capital is at risk. Past performance does not guarantee future results.
Important Information
The information contained herein reflects the views of AllianceBernstein L.P. or its affiliates and sources it believes are reliable as of the date of this publication. AllianceBernstein L.P. makes no representations or warranties concerning the accuracy of any data. There is no guarantee that any projection, forecast or opinion in this material will be realized.
The views expressed herein may change at any time after the date of this publication. AllianceBernstein L.P. does not provide tax, legal or accounting advice. It does not take an investor’s personal investment objectives or financial situation into account; investors should discuss their individual circumstances with appropriate professionals before making any decisions.
References to specific securities are provided solely in the context of the analysis presented and are not to be considered recommendations by AllianceBernstein. AllianceBernstein and its affiliates may have positions in, and may effect transactions in, the markets, industry sectors and companies described herein.
MSCI makes no express or implied warranties or representations and shall have no liability whatsoever with respect to any MSCI data contained herein. The MSCI data may not be further redistributed or used as a basis for other indices or any securities or financial products. This report is not approved, reviewed or produced by MSCI.
Note to All Readers: The information contained here reflects the views of AllianceBernstein L.P. or its affiliates and sources it believes are reliable as of the date of this publication. AllianceBernstein L.P. makes no representations or warranties concerning the accuracy of any data. There is no guarantee that any projection, forecast or opinion in this material will be realized.
Note to Readers in Canada: This publication has been provided by AllianceBernstein Canada, Inc. or Sanford C. Bernstein & Co., LLC and is for general information purposes only. It should not be construed as advice as to the investing in or the buying or selling of securities, or as an activity in furtherance of a trade in securities. Neither AllianceBernstein Institutional Investments nor AllianceBernstein L.P. provides investment advice or deals in securities in Canada. Note to Readers in the United Kingdom: Issued by AllianceBernstein Limited, 50 Berkeley Street, London W1J 8HA, registered in England, No. 2551144. AllianceBernstein Limited is authorised and regulated in the UK by the Financial Conduct Authority (FCA). Note to Readers in Europe: This information is issued by AllianceBernstein (Luxembourg) S.a r.l. Societe a responsabilite limitee, R.C.S. Luxembourg B 34 305, 2-4, rue Eugene Ruppert, L-2453 Luxembourg. Authorised in Luxembourg and regulated by the Commission de Surveillance du Secteur Financier (CSSF). Note to Readers in Switzerland: Issued by AllianceBernstein Schweiz AG, Zurich, a company registered in Switzerland under company number CHE-306.220.501. AllianceBernstein Schweiz AG is authorised and regulated in Switzerland by the Swiss Financial Market Supervisory Authority (FINMA) as a distributor of collective investment schemes. This information is directed at Qualified Investors only. Note to Australian and New Zealand Readers: For Institutional Investor use only. Not for inspection by, distribution or quotation to, the general public. This document has been issued by AllianceBernstein Australia Limited (ABN 53 095 022 718 and AFSL 230698). Information in this document is intended only for persons who qualify as “wholesale clients,” as defined in the Corporations Act 2001 (Cth of Australia) or the Financial Advisers Act 2008 (New Zealand), and is general in nature and does not take into account any person’s objectives, financial situation or needs. Note to Readers in Hong Kong: For Institutional Investor use only. Not for inspection by, distribution or quotation to, the general public. This document is issued in Hong Kong by AllianceBernstein Hong Kong Limited (聯博香港有限公司). This document has not been reviewed by the Hong Kong Securities and Futures Commission. Note to Readers in Japan: For Institutional Investor use only. Not for inspection by, distribution or quotation to, the general public. This document has been provided by AllianceBernstein Japan Ltd. AllianceBernstein Japan Ltd. Is a registered investment-management company (registration number: Kanto Local Financial Bureau no. 303). It is also a member of the Japan Investment Advisers Association; the Investment Trusts Association, Japan; the Japan Securities Dealers Association; and the Type II Financial Instruments Firms Association. The product/service may not be offered or sold in Japan; this document is not made to solicit investment. Note to Readers in Singapore: For Institutional Investor use only. Not for inspection by, distribution or quotation to, the general public. This document has been issued by AllianceBernstein (Singapore) Ltd. (“ABSL”, Company Registration No. 199703364C). AllianceBernstein (Luxembourg) S.a r.l. is the management company of the Portfolio and has appointed ABSL as its agent for service of process and as its Singapore representative. AllianceBernstein (Singapore) Ltd. is regulated by the Monetary Authority of Singapore. This advertisement has not been reviewed by the Monetary Authority of Singapore. Note to Readers in Taiwan: For Institutional Investor use only. Not for inspection by, distribution or quotation to, the general public. This document is provided solely for informational purposes and is not investment advice, nor is it intended to be an offer or solicitation, and does not pertain to the specific investment objectives, financial situation or particular needs of any person to whom it is sent. This document is not an advertisement. AllianceBernstein L.P. is not licensed to, and does not purport to, conduct any business or offer any services in Taiwan. Note to Readers in China: For Institutional Investor use only. Not for inspection by, distribution or quotation to, the general public. This document is provided by AllianceBernstein (“AB”). This document has been provided to you for sole use in a private and confidential meeting. This document is not an advertisement and is not intended for public use or distribution to any third party beyond our private meeting. This document or any information contained or incorporated by reference herein does not constitute an offer to sell or the solicitation of an offer to purchase any financial instrument, product or service sponsored by AB or its affiliates within the People’s Republic of China (“PRC,” for such purposes, excluding Hong Kong, Macao and Taiwan). AB does not provide tax, legal or accounting advice. In considering this material, you should discuss your individual circumstances with professionals in those areas before making any decisions. Note to Readers in Vietnam, the Philippines, Brunei, Thailand, Indonesia and India: For Institutional Investor use only. Not for inspection by, distribution or quotation to, the general public. This document is provided solely for informational purposes and is not investment advice, nor is it intended to be an offer or solicitation, and does not pertain to the specific investment objectives, financial situation or particular needs of any person to whom it is sent. This document is not an advertisement. AB is not licensed to, and does not purport to, conduct any business or offer any services in any of the above countries.
The [A/B] logo is a registered service mark of AllianceBernstein and AllianceBernstein® is a registered service mark used by permission of the owner, AllianceBernstein L.P.
© 2022 AllianceBernstein L.P., 501 Commerce St., Nashville, TN 37203