
Seeking more consistent returns through the swings of emerging markets
Why Emerging Markets?
Emerging markets can offer the potential for strong long-term growth and income generation if you have the expertise to actively seek out the most attractive investment opportunities, while managing the associated risk and volatility. Exposure to EM can also offer diversification to complement a broader developed market portfolio.

Drivers of Change and Innovation
Themes such as the continuing rise of middle-class wealth, accelerated digital transformation, nearshoring and decarbonization are set to be key growth drivers across asset classes. Many EM companies are at the forefront of innovation in these areas, presenting attractive investment opportunities.

Market and Macro Catalysts
Following a prolonged period of underperformance, emerging markets have delivered a strong rebound. Performance has been driven by improving earnings momentum, attractive valuations, and a broadening of leadership, alongside stronger domestic demand, rising capital investment, and shifting currency and rate dynamics across regions.

Alpha* Potential and Diversification
The variety within EM across geographies, asset classes and sectors present a unique opportunity to uncover a range of diversified, high quality investment ideas—and to capture alpha potential. EM assets also tend to have low correlation with developed market assets, offering diversification benefits and potentially reducing overall portfolio risk.
*Alpha is a measure of the active return on an investment ie. the performance of that investment compared with a suitable market index.
Why AB for Emerging Markets?
Blending Art and Science for Better Outcomes
AB’s approach to EM offers investors unique insight. We combine quantitative and fundamental research with market leading technology. This “quantamental” approach blends art and science to create a proprietary view that can better identity opportunities across emerging markets. Quantitative research uses historical data and statistical techniques to identify the areas with most return potential. Fundamental research can uncover opportunities and identify downside risks based on human experience and perspective.

EM equities with more peace of mind
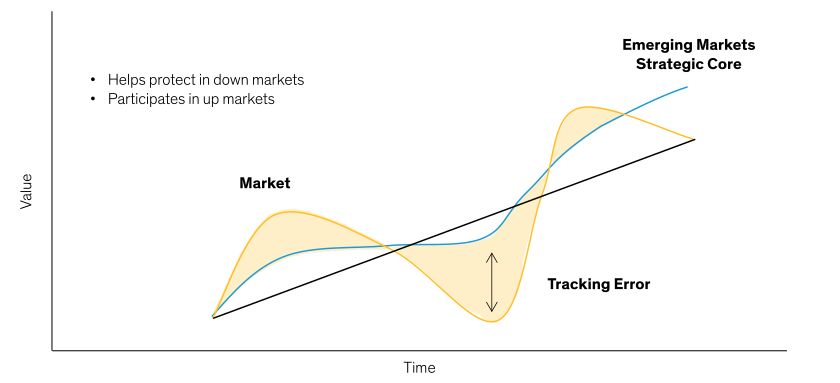
- At AB we believe EM equities deserve a place in client portfolios as a strategic growth allocation, but we also know that emerging markets can be volatile. That’s why we developed our strategic core framework which aims to capture 90% of the upside but only 70% of the downside over the long term.
- You can now access the AB Emerging Markets Strategic Core Equities Fund - Active ETF and participate in emerging market growth with greater peace of mind.

90/70
Targeting a 90/70 up/down market capture to deliver steady equity returns amid changing market conditions.

QSP
Unlock compelling investment opportunities through Quality, Stability and Price

Quantamental
An effective quantamental investment approach helps provide a buffer against unexpected events while optimizing risk-adjusted return.
Equity returns with lower volatility
With a portfolio that falls less than the market during downturns, the pain of losses is lessened, making it easier for your clients to stick with their investments through turbulent times.
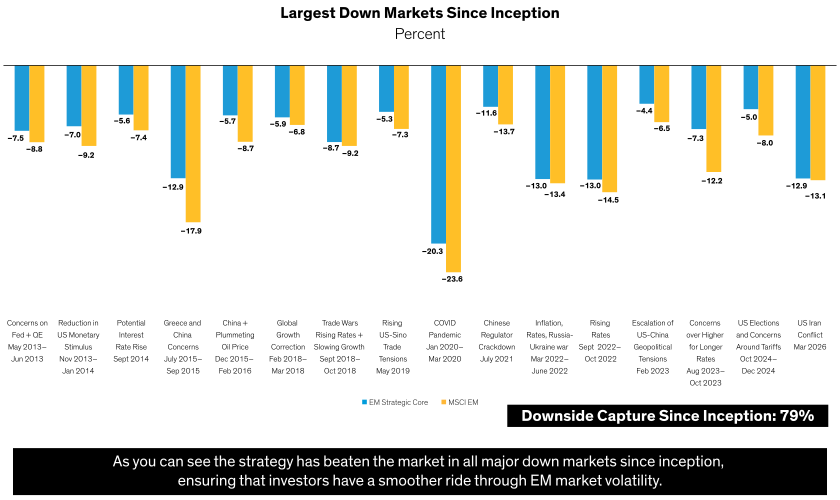
Past performance does not guarantee future results. Based on a representative account since inception of the EM Strategic Core Equity composite—June 30, 2012. This is supplemental information to the GIPS-compliant performance and disclosure page. Numbers may not sum due to rounding. The returns presented above are shown net of management fees (with the exception of the first two periods, where daily data is not available). Net performance figures have been calculated by deducting the highest fee payable by a separately managed institutional account; 1.0% of assets, annually. Investment advisory fees are described in Part 2A of AB’s Form ADV. This is supplemental information to the GIPS-compliant performance and disclosure page.
As of March 31, 2026
Source: MSCI and AB; see the AB GIPS Report.
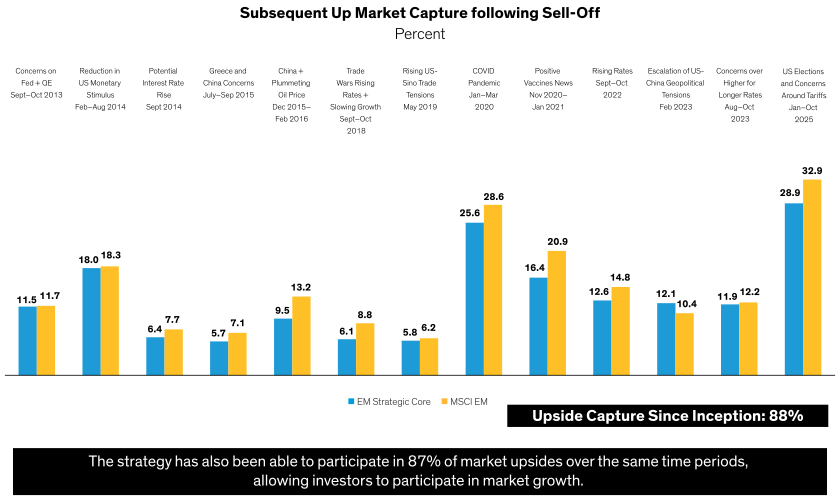
Past performance does not guarantee future results. Based on a representative account since inception of the EM Strategic Core Equity composite—June 30, 2012. This is supplemental information to the GIPS-compliant performance and disclosure page. Numbers may not sum due to rounding. The returns presented above are shown net of management fees (with the exception of the first two periods, where daily data is not available). Net performance figures have been calculated by deducting the highest fee payable by a separately managed institutional account; 1.0% of assets, annually. Investment advisory fees are described in Part 2A of AB’s Form ADV. This is supplemental information to the GIPS-compliant performance and disclosure page.
As of March 31, 2026
Source: MSCI and AB; see the AB GIPS Report at the conclusion of this presentation.
Insights

Chinese equities deserve closer attention from investors who may have avoided the market amid geopolitical tensions.

Emerging-market assets have benefitted from a softer dollar, which could remain weak for a while.

Emerging-market corporate bonds benefit from an intrinsic barbell.

Earnings growth could continue energizing an emerging-market stock recovery.
AllianceBernstein Investment Management Australia Limited (ABN 58 007 212 606, AFSL 230 683) (“ABIMAL”) is the responsible entity of the AB Emerging Markets Strategic Core Equities Fund – Active ETF (ARSN 690 408 783) (“Fund”) and is the issuer of units in the Fund. ABIMAL has appointed AllianceBernstein Australia Limited (ABN 53 095 022 718, AFSL 230 698) (“ABAL”) as the investment manager of the Fund. ABAL in turn has delegated a portion of the investment manager function to AllianceBernstein L.P. The Fund’s Product Disclosure Statement (“PDS”) is available by contacting the client services team at AllianceBernstein Australia Limited at (02) 9255 1299 or at www.alliancebernstein.com.au. Investors should consider the PDS in deciding to acquire, or continue to hold, units in the fund.
A Target Market Determination (“TMD”) for the Fund is available free of charge from our website www.alliancebernstein.com.au. The TMD sets out the class of persons who comprise the target market for the Fund and the distribution conditions that are applicable, together with a number of other matters which should be considered by retail investors and their advisers.
Information, forecasts and opinions (“Information”) set out in this document are not personal advice and have not been prepared for any recipient’s specific investment objectives, financial situation or particular needs. Neither this document nor the information contained in it are intended to take the place of professional advice. Please note that past performance is not indicative of future performance and projections, although based on current information, may not be realised. Information, forecasts and opinions can change without notice, and neither ABIMAL or ABAL guarantees the accuracy of the information at any particular time. Although care has been exercised in compiling the information contained in this report, neither ABIMAL or ABAL warrants that this document is free from errors, inaccuracies or omissions.
This document is released by ABAL.
AB GIPS Report
Emerging Markets Strategic Core Equity Composite (in Australian dollars)
| Period | Composite Assets (AUD Millions) |
Composite Accounts at End of Period |
Gross Return (%) |
Net Return (%) |
Internal Composite Dispersion (%) |
Composite 3-Year Ann. ex Post Standard Deviation (%) |
Benchmark 3- Year Ann. ex Post Standard Deviation (%) |
Total Firm Assets (AUD Billions) |
MSCI Emerging Markets Index Return (%) |
|---|---|---|---|---|---|---|---|---|---|
| 2025 | 2090.5 | 4 | 22.04 | 20.83 | 0.09 | 8.29 | 9.49 | 1084.9 | 24.01 |
| 2024 | 1618.5 | 3 | 26.94 | 25.68 | 0.06 | 11.16 | 12.03 | 1072.1 | 18.48 |
| 2023 | 1445.2 | 3 | 19.4 | 18.22 | 0.03 | 9.6 | 11.38 | 901.5 | 9.15 |
| 2022 | 1244.6 | 3 | -16.08 | -16.91 | 0.06 | 11.24 | 12.99 | 804.2 | -14.33 |
| 2021 | 1581.8 | 3 | 5.05 | 4.01 | 0.04 | 9.45 | 11.39 | 941.9 | 3.44 |
| 2020 | 1501.9 | 2 | 7.33 | 6.26 | NM | 10.32 | 11.72 | 791.9 | 7.77 |
| 2019 | 2231 | 1 | 17.25 | 16.09 | NM | 8.44 | 9.67 | 817.2 | 18.61 |
| 2018 | 1265.3 | 2 | -6.73 | -7.65 | 0.02 | 8.17 | 8.96 | 672.6 | -5.08 |
| 2017 | 436.1 | 2 | 24.16 | 22.93 | 0.02 | 8.58 | 10.41 | 655.8 | 27.09 |
| 2016 | 145.8 | 4 | 9.85 | 8.76 | 0.08 | 9.06 | 10 | 613.9 | 11.72 |
| 3 Years* | 22.75 | 21.54 | 17.05 | ||||||
| 5 Years* | 10.27 | 9.18 | 7.28 | ||||||
| 10 Years* | 10.07 | 8.98 | 9.37 |
NM: not meaningful, fewer than two accounts were included in the Composite for the full period
*Annualized through most recent year-end
Presentation of the Firm: AllianceBernstein L.P. (“ABLP”) is a registered investment advisor with the US Securities and Exchange Commission. AB Institutional Investments and AB Investments (collectively, the “Firm”) are the institutional and retail sales, marketing, and client service units of ABLP. In February 2006, Alliance Capital Management L.P. changed its name to ABLP.
Compliance Statement: The Firm claims compliance with the Global Investment Performance Standards (GIPS®) and has prepared and presented this report in compliance with the GIPS standards. The Firm has been independently verified for the periods from January 1, 1993, through December 31, 2024. The verification reports are available upon request. A firm that claims compliance with the GIPS standards must establish policies and procedures for complying with all the applicable requirements of the GIPS standards. Verification provides assurance on whether the firm’s policies and procedures related to composite and pooled fund maintenance, as well as the calculation, presentation and distribution of performance, have been designed in compliance with the GIPS standards and have been implemented on a firmwide basis. Verification does not provide assurance on the accuracy of any specific performance report.
Composite Description: The performance results displayed herein represent the investment performance record for the Emerging Markets Strategic Core Equity Composite (the “Composite”). The Composite includes all fee-paying institutional discretionary accounts and, when applicable, pooled investment vehicles. The Composite consists of accounts that invest primarily in equity securities of companies that are based in emerging-market countries or that have significant exposure to emerging-market countries, and seek a long-term premium relative to their benchmark, with little sensitivity to benchmark risk. As of December 31, 2012, December 31, 2013 and March 31, 2014, 100%, 10% and 6% of the Composite’s assets were in a non-fee-paying proprietary account, respectively. Investments in emerging-market countries may have more risk because these markets are less developed and less liquid, and because these investments may be subject to increased economic, political, regulatory or other uncertainties. The creation date of this Composite is September 2012 and the inception date is June 30, 2012.
For the performance period presented, Investment Professionals may have changed or departed, none of which in the Firm’s view have altered the Composite’s strategy.
Accounts in the Composite may utilize derivative contracts including, but not limited to, swaps, swaptions, options, futures, options on futures and currency transactions for risk management purposes or for enhancing expected returns by adjusting exposure to the markets, sectors, countries, currencies or specific securities permitted by these guidelines. The impact of all derivatives is fully incorporated into the calculation of risk and return, and the use of derivatives shall not violate the investment guidelines that limit exposure to markets, sectors, countries, currencies or specific securities. Investment in non-exchange-traded (over-the-counter) derivatives exposes the accounts within the Composite to counterparty risk.
A complete list including composite descriptions, pooled fund descriptions for limited distribution pooled funds, and broad distribution funds managed by the Firm is available upon request. Additional information regarding policies for valuing investments, calculating performance and preparing GIPS reports is also available upon request via email to compositerequests@alliancebernstein.com.
Total Return Methodology and Fee Structure: Performance figures in this presentation have been presented gross and net of model investment-management fees. Net performance figures have been calculated by deducting the highest fee payable by a separately managed institutional account; 1.00% of assets, annually. The Composite may contain mutual funds with share classes that incur higher management fees. The current investment advisory fee schedule applicable for this Composite is as follows:
Segregated Account
1.00% on the first 25 million in USD
0.90% on the next 25 million in USD
0.75% on the balance
AB Canada Emerging Markets Strategic Core Equity Fund
1.00% on the first 25 million in CAD
0.90% on the next 25 million in CAD
0.75% on the balance
Annual expense ratio = 1.00%
AB DBT - Emerging Markets Strategic Core Equity Series
1.00% on the first 25 million in USD
0.90% on the next 25 million in USD
0.75% on the balance
Annual expense ratio = 1.00%
Rate of Return: No representation is made that the performance shown in this presentation is indicative of future performance. An account could incur losses as well as generate gains. Performance figures for each account are calculated monthly on a trade-date basis using a total rate-of-return calculation. Investment transactions are recorded on a trade date basis, and interests and dividends are recorded on accrual basis, net of withholding taxes, if applicable. Investments in securities are valued in accordance with the Firm's Valuation Policies and reflect a good faith estimate of fair value levels for all investments, which may not be realized upon liquidation. The fair valuation process requires judgment and estimation by the Firm. The gross-of-fee returns reflect the deduction of trading costs. Account returns are net of foreign withholding taxes. The benchmark returns are net of withholding taxes from a Luxembourg tax perspective. The Composite returns are calculated based on the asset-weighted monthly composite constituent account returns where the weight is the beginning fair value of the accounts.
Dispersion: Internal dispersion is calculated using the asset-weighted standard deviation of gross-of-fee return for all accounts included in the Composite for the entire year; it is not presented for periods less than one year or when there were fewer than two accounts in the Composite for the entire year. The three-year annualized ex post standard deviation measures the variability of the Composite’s gross-of-fee return and the benchmark returns over the preceding 36-month period; it is not presented for periods of less than three years.
The benchmark is the MSCI Emerging Markets Index.
GIPS® is a registered trademark of CFA Institute. CFA Institute does not endorse or promote this organization, nor does it warrant the accuracy or quality of the content contained herein.