Q1 2026
Capital Markets Outlook
Highlights
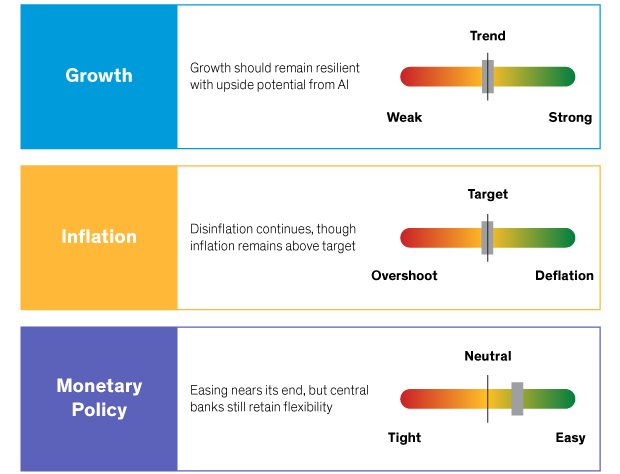
- Macro
- Rates
- Credit
- EMD
- Equity
As of December 31, 2025
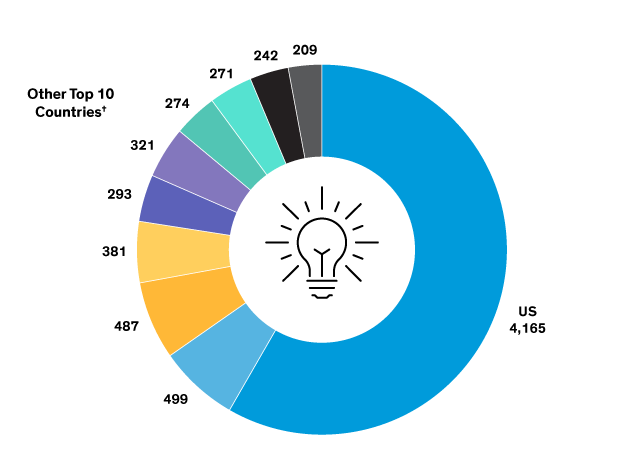
Source: Statista and AB
As of November 30, 2025
Source: Statista and AB
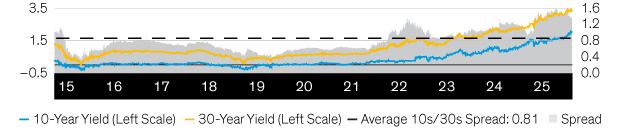
As of December 31, 2025
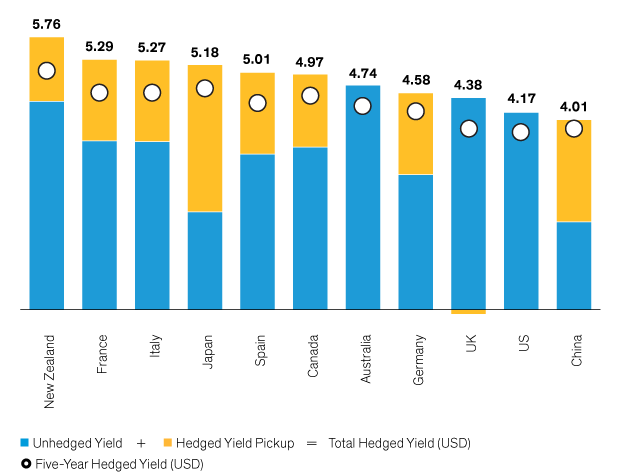
Source: Bloomberg and AB
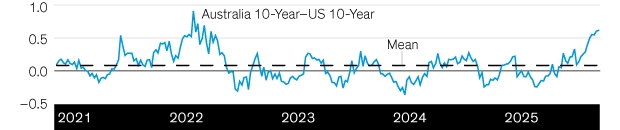
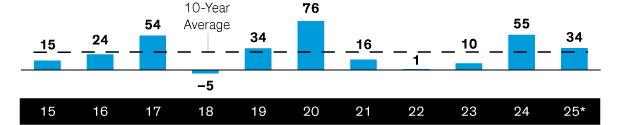
As of December 31, 2025
Source: Bloomberg and AB
As of December 31, 2025
Source: Bloomberg and AB
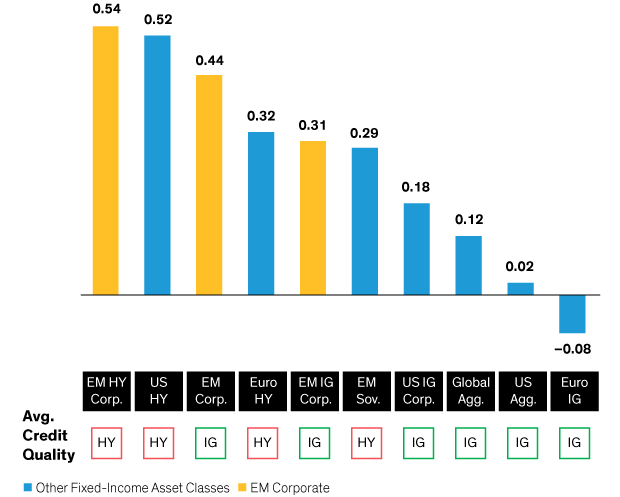
As of December 31, 2025
Source: Bloomberg, J.P. Morgan and AB
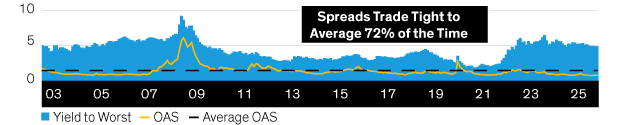
Average since January 1, 2003
As of December 31, 2025
Source: Bloomberg, J.P. Morgan and AB
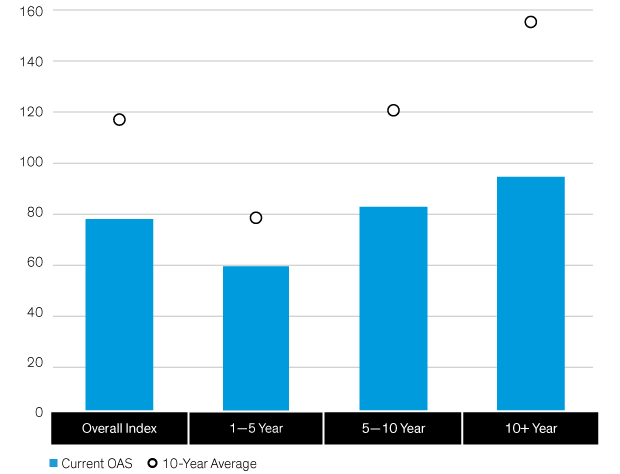
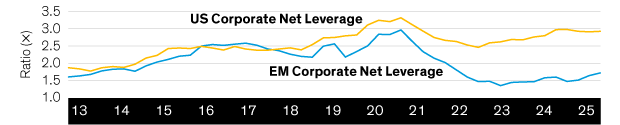
Index represented by Bloomberg US Corporate
As of December 31, 2025
Source: Bloomberg, J.P. Morgan and AB
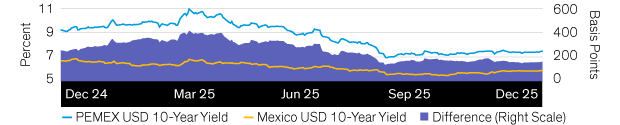
As of December 31, 2025
Source: Bank of America, Bloomberg, J.P. Morgan and AB
As of June 30, 2025
Source: Bank of America, Bloomberg, J.P. Morgan and AB
As of December 31, 2025
Source: Bank of America, Bloomberg, J.P. Morgan and AB
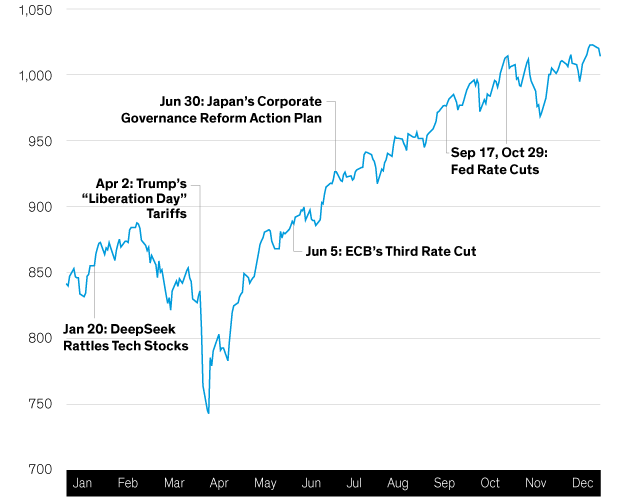
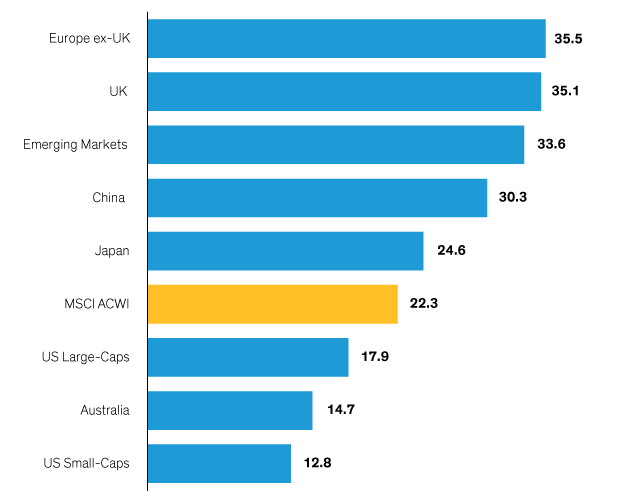
As of December 31, 2025
Source: FactSet, FTSE Russell, MSCI, S&P and AB
As of December 31, 2025
Source: FactSet, FTSE Russell, MSCI, S&P and AB