
Take Advantage of Today’s Potential Fixed-Income Opportunities
Consider Active ETFs for Your Clients’ Investment Goals
While current bond yields remain high, the Fed is expected to cut interest rates sometime this year. Investors focused on timing Fed rate cuts could miss out. We think the “when” is less important than “how” you’re positioned for the current bond opportunity. AB’s active exchange-traded funds (ETFs) may help.
Embrace Active and Adapt
In volatile times, active ETFs offer investment expertise with potential liquidity, flexibility and speed.
Avoid a Missed Opportunity
Market timing is next to impossible. We believe a fully invested program includes fixed income and a good first step may be ultra short duration fixed income.
Tap High-Yield Potential
High-yield bonds may offer a significant opportunity for yield potential with historically lower volatility than stocks.1
Consider Active Bond ETFs Built for Today’s Volatile Market
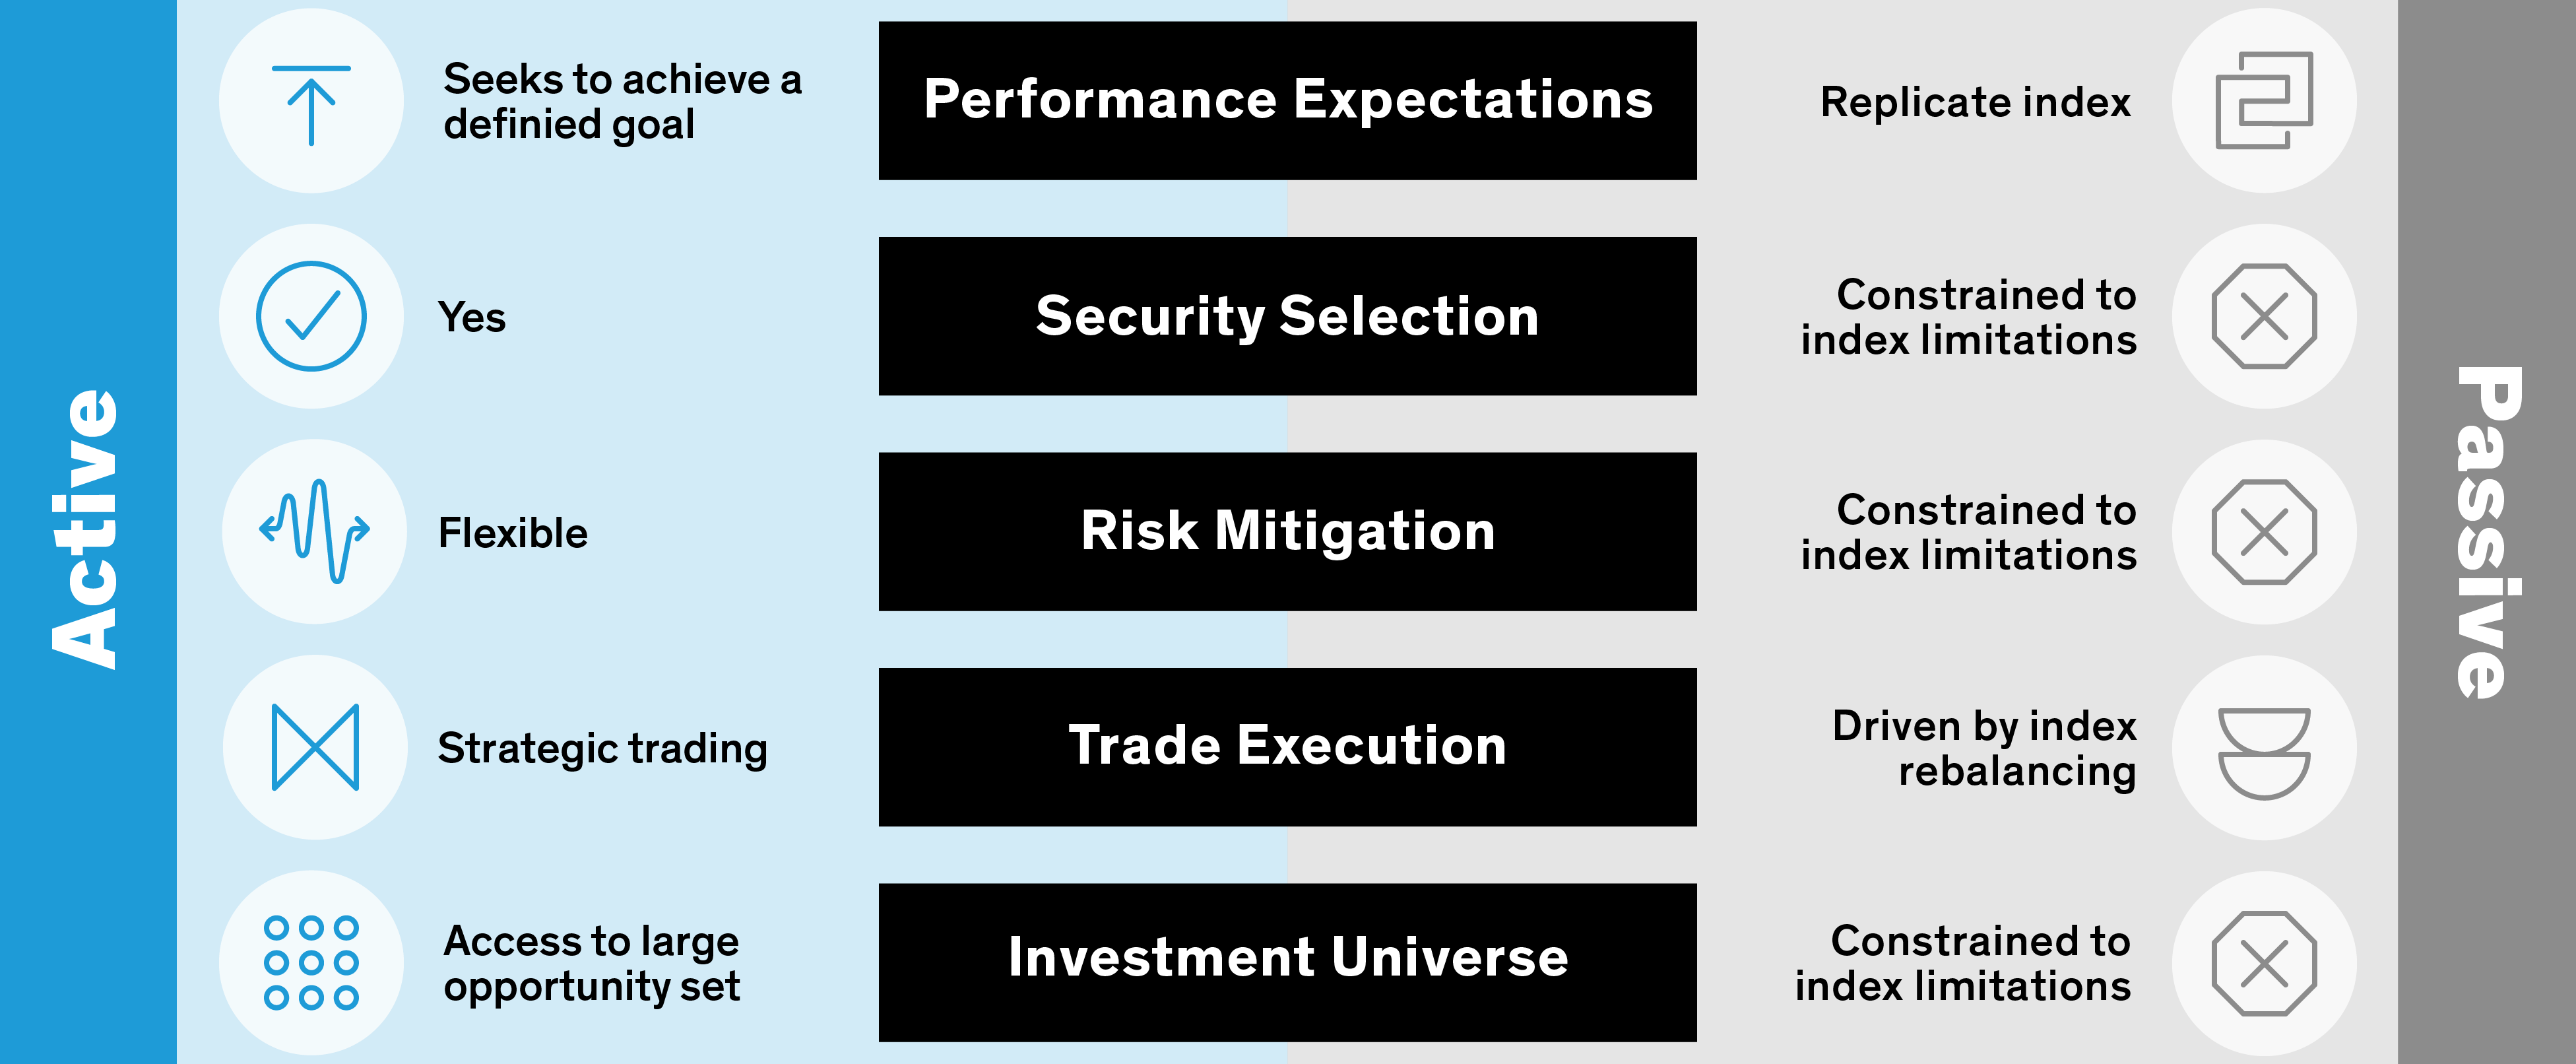
Many investors lean on active fixed income in an uncertain environment where flexibility counts. Active managers can play offense and defense, adjusting levers such as duration, credit quality and tactical allocation. Meanwhile, passive funds are designed to track an index. Active ETFs are an increasingly popular way to access active expertise with liquidity, flexibility and speed.
Don’t Wait on Rate Cuts to Access Higher Yield Potential
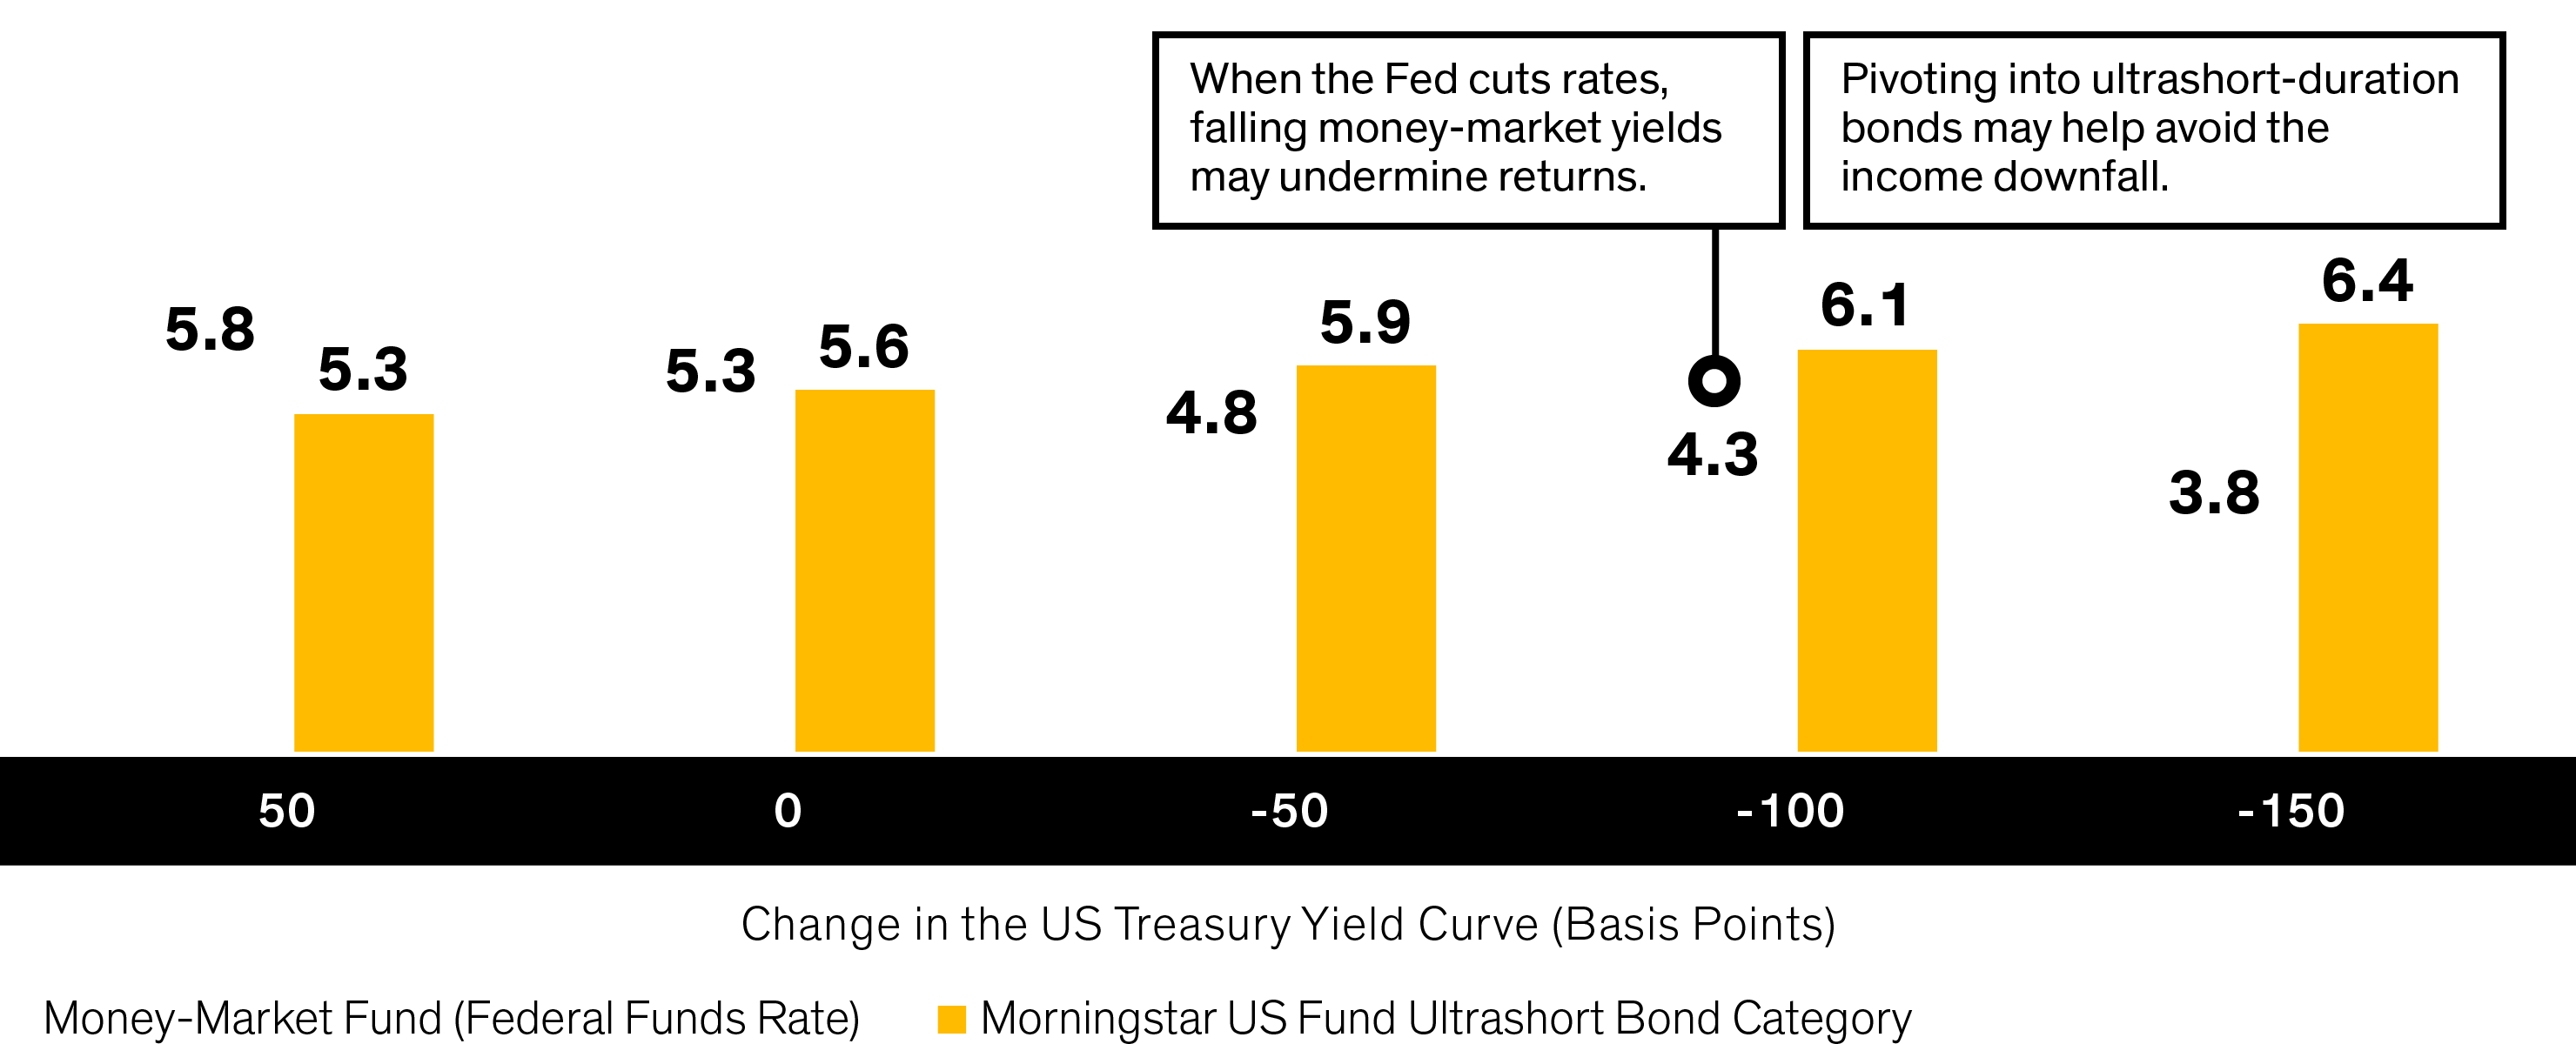
Money-market yields have tracked the fed funds rate closely2 and, if the Fed cuts rates as expected, investors on the sidelines could face a rude surprise. Instead of trying to time the market, a pivot into ultrashort-duration ETFs like AB Ultra Short Income ETF (ticker: YEAR) may help to lock in today’s yields and help set investors up well for multiple rate scenarios.
Pursue a Yield Advantage Over Money-Markets While the Time is Right
Expected 12-Month Returns of Ultrashort and Money-Market Funds When Rates Change (Percent)*
Current and historical analyses do not guarantee future
results.
*Shock analysis assumes the potential impact of an instantaneous parallel shift
(across the whole curve) in US Treasury yields and the resultant yield over the next 12 months.
Utilizes the Effective Federal Funds Rate for Money-Market Fund yield: 5.33 and the Morningstar
US Fund Ultrashort Bond category average yield and duration: 5.60% and 0.54 years, respectively.
Duration is a measurement of the sensitivity of a security to changes in interest rates. Analysis
ignores correlations between Treasuries and other sectors that the portfolio invests in.
The actual moves in spreads and Treasury yields may differ meaningfully from the sample moves shown.
As of December 31, 2023
Source: Morningstar and AB
Ultrashort Bond
- When the Fed cuts rates, money-market yields quickly follow, forcing investors to reinvest at lower yields.
- Investors who pivot into ultra-short bonds now may pick up yield and set themselves up for possible price gains if the Fed cuts.
- Ultra-short bonds have similar return potential to cash equivalents if rates rise... and better potential if they stay put.
With ETFs such as AB Ultra Short Income ETF (YEAR), investors can make the shift seamlessly.
Pursue a Yield Advantage Over Money-Markets While the Time is Right
Expected 12-Month Returns of Ultrashort and Money-Market Funds When Rates Change (Percent)*
Current and historical analyses do not guarantee future
results.
*Shock analysis assumes the potential impact of an instantaneous parallel shift
(across the whole curve) in US Treasury yields and the resultant yield over the next 12 months.
Utilizes the Effective Federal Funds Rate for Money-Market Fund yield: 5.33 and the Morningstar
US Fund Ultrashort Bond category average yield and duration: 5.60% and 0.54 years, respectively.
Duration is a measurement of the sensitivity of a security to changes in interest rates. Analysis
ignores correlations between Treasuries and other sectors that the portfolio invests in.
The actual moves in spreads and Treasury yields may differ meaningfully from the sample moves shown.
As of December 31, 2023
Source: Morningstar and AB
Tap into Today’s Attractive Potential in High Yield
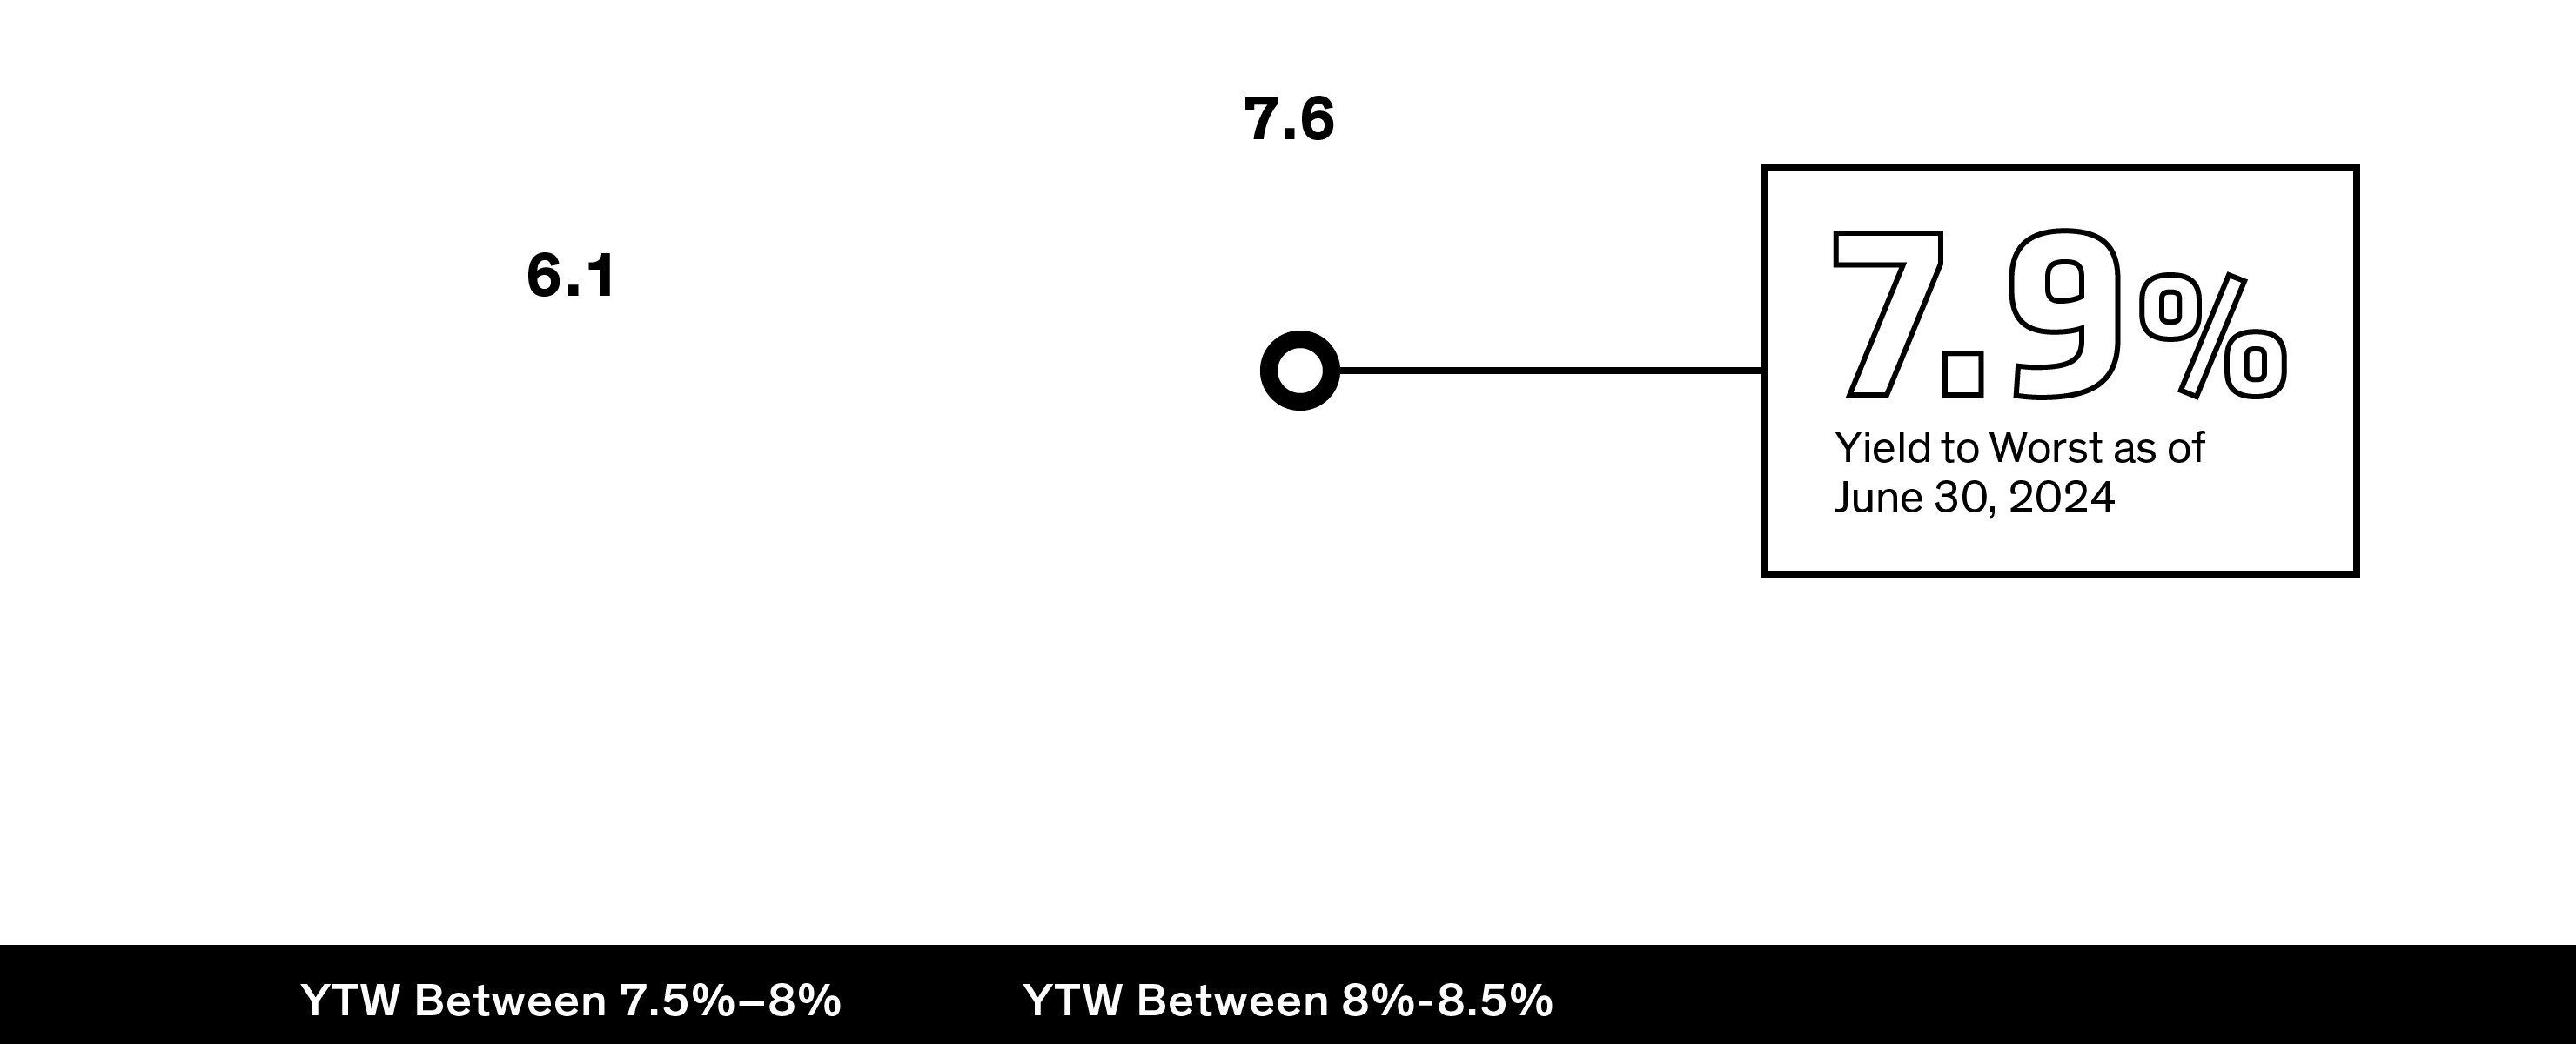
With yields topping 7% early in 20243 and history suggesting a close connection between starting yields and forward high-yield corporate returns (display), we think high yield offers the potential for equity-like returns with less risk. But an active approach that minimizes default risk is key: AB High Yield ETF (ticker: HYFI) has been able to do just that through fundamental and quantitative security analysis. Over the last five years, the number of bonds in the HYFI portfolio that defaulted averaged 0.6% annually versus 2.4% for the Bloomberg US High Yield Index.4
High-Yield Corporate Bonds Offer an Attractive Entry Point
Five-Year Annualized High-Yield Index Returns Based on Starting Yield to Worst (YTW), 1987-2023 (Percent)
Current and historical analyses do not guarantee future
results.
YTW: yield to worst. High yield represented by Bloomberg US Corporate High
Yield Index.
As of
June 30, 2024
Source: Bloomberg
and Morningstar
High Yield Bond
- History shows a close link between starting yields and forward high-yield total returns.
- Yields started 2024 north of 7%, an enticing income level that's also equivalent to the historical equity risk premium.
- Avoiding defaults is key to reaping that income and potential-and we think security-level fundamental and quantitative analysis is key.
Access high income and active security selection to help mitigate downside risk with AB High Yield ETF (HYFI).

Why LPL Advisors Choose AllianceBernstein for Fixed Income
AllianceBernstein and LPL agree—bonds have the potential to offer compelling value in 2024. Whether you’re looking for income, liquidity, diversification, or a combination of the three—consider AllianceBernstein.
View Products
AB Ultra Short Income ETF (YEAR)
Ultra-short duration ETF that seeks to deliver high yield relative to cash while emphasizing stability and liquidity.
AB High Yield ETF (HYFI)
High-yield ETF that seeks to maximize income and captial appreciation.
1 From inception through September 30, 2023, US High Yield volatility: 8.4% versus 15.8% for S&P 500 Index. US High Yield current yield: 7.6% versus 1.5% for S&P 500 Index. US High Yield is represented by Bloomberg US Corporate High Yield Index, inception date 7/1/1983; S&P 500 since 1/1/1957. Based on monthly returns. Current yield for S&P 500 calculated as estimated forward dividend yield and for High Yield current yield is based on current yield to worst. Source: Bloomberg, S&P and AllianceBernstein
2 From 2000 to 2023, the US Treasury 3 Month Bill Money Market Yield was 99% correlated to the fed funds rate. Source: Bloomberg
3 High Yield (represented by Bloomberg US Corporate High Yield Index) yield to worst was 7.6% on December 31, 2023. Source: Bloomberg
4 Average default rate based on data from Jan 2019- Dec 2023. Source: Bloomberg, Barclays, AllianceBernstein
Duration can measure the sensitivity of a bond’s or fixed-income portfolio’s price to changes in interest rates.
Credit quality is a measure of the financial solvency of an entity, such as a company or a government. Specifically, it is an evaluation of the ability of that person or entity to repay their debts.
The federal funds rate refers to the target interest rate range set by the Federal Open Market Committee.
Net asset value is the price at which the shares of the funds are traded.
Yield to worst is a measure of the lowest possible yield that can be received on a bond that fully operates within the terms of its contract without defaulting.
The Bloomberg US Corporate High Yield Bond Index measures the USD-denominated, high-yield, fixed-rate corporate bond market. Securities are classified as high yield if the middle rating of Moody’s, Fitch and S&P is Ba1/BB+/BB+ or below.
The S&P 500 Index is a stock market index tracking the stock performance of 500 of the largest companies listed on stock exchanges in the United States
For the most current SEC standardized performance, click here for YEAR and click here for HYFI.
Investing in ETFs involves risks, including loss of principal.
Investors should consider the investment objectives, risks, charges and expenses of the Fund carefully before investing. For copies of a Fund’s prospectus or summary prospectus, which contain this and other information, visit us online at www.alliancebernstein.com or contact your AB representative. Please read the prospectus and/or summary prospectus carefully before investing.
Shares of the ETF may be bought or sold throughout the day at their market price on the exchange on which they are listed. The market price of an ETF’s shares may be at, above or below the ETF’s net asset value (“NAV”) and will fluctuate with changes in the NAV as well as supply and demand in the market for the shares. Shares of the ETF may only be redeemed directly with the ETF at NAV by Authorized Participants, in very large creation units. There can be no guarantee that an active trading market for the Fund’s shares will develop or be maintained, or that their listing will continue or remain unchanged. Buying or selling the Fund’s shares on an exchange may require the payment of brokerage commissions and frequent trading may incur brokerage costs that detract significantly from investment returns.
Below-Investment-Grade Securities Risk: Investments in fixed-income securities with lower ratings (aka junk bonds) are subject to a higher probability that an issuer will default or fail to meet its payment obligations. These securities may be subject to greater price volatility due to such factors as specific municipal or corporate developments and negative performance of the junk bond market generally and may be more difficult to trade than other types of securities. Credit Risk: A bond’s credit rating reflects the issuer’s ability to make timely payments of interest or principal—the lower the rating, the higher the risk of default. If the issuer’s financial strength deteriorates, the issuer’s rating may be lowered, and the bond’s value may decline. Derivatives Risk: Derivatives may be more sensitive to changes in market conditions and may amplify risks. Foreign (Non-US) Risk: Non-US securities may be more volatile because of political, regulatory, market and economic uncertainties associated with such securities. Fluctuations in currency exchange rates may negatively affect the value of the investment or reduce returns. These risks are magnified in emerging or developing markets. Inflation Risk: Prices for goods and services tend to rise over time, which may erode the purchasing power of investments. Investment Securities Risk: To the extent the Fund invests in other funds, shareholders will bear two layers of asset-based expenses, which could reduce returns. Leverage Risk: Trying to enhance investment returns by borrowing money or using other leverage tools magnify both gains and losses, resulting in greater volatility. Market Risk: The market values of the portfolio’s holdings rise and fall from day to day, so investments may lose value.
AllianceBernstein ETFs are distributed by Foreside Fund Services, LLC, in the US only. Foreside is not affiliated with AllianceBernstein.