-
Past performance, historical and current analyses, and expectations do not guarantee future results. There can be no assurance that any investment objectives will be achieved. The information contained here reflects the views of AllianceBernstein L.P. or its affiliates and sources it believes are reliable as of the date of this publication. AllianceBernstein L.P. makes no representations or warranties concerning the accuracy of any data. There is no guarantee that any projection, forecast or opinion in this material will be realized. Past performance does not guarantee future results. The views expressed here may change at any time after the date of this publication. This document is for informational purposes only and does not constitute investment advice. AllianceBernstein L.P. does not provide tax, legal or accounting advice. It does not take an investor’s personal investment objectives or financial situation into account; investors should discuss their individual circumstances with appropriate professionals before making any decisions. This information should not be construed as sales or marketing material or an offer or solicitation for the purchase or sale of any financial instrument, product or service sponsored by AB or its affiliates.
The views expressed herein do not constitute research, investment advice, or trade recommendations and do not necessarily represent the views of all AB portfolio-management teams.
MSCI makes no express or implied warranties or representations, and shall have no liability whatsoever with respect to any MSCI data contained herein. The MSCI data may not be further redistributed or used as a basis for other indices or any securities or financial products. This report is not approved, reviewed or produced by MSCI.
Dimensioning Today's Middle Market Lending Opportunity
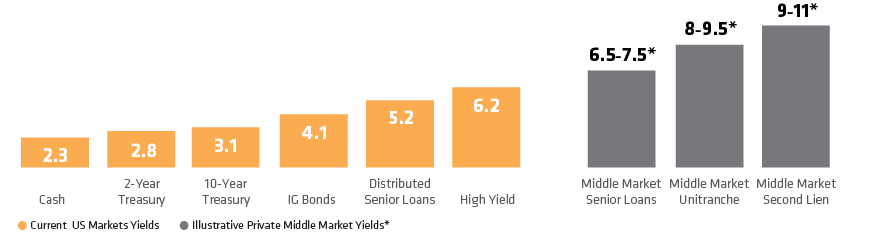
As of September 30, 2018
For illustrative purposes only. Cash is represented by 1-MO. USD LIBOR, 2-Yr. Treasury by Bloomberg US Generic Government 2-Yr. Yield, 10-Yr. Treasury by Bloomberg US Generic Government 10-Yr. Yield, investment-grade (IG) bonds by Bloomberg Barclays US Corporate Investment Grade, distributed senior loans by S&P/LSTA US Leveraged Loan 100 and high yield by the Bloomberg Barclays US Corporate HY 2% Issuer Cap. 2-Yr. Treasury and distributed senior loans yields represented by yield to maturity. IG bonds and high yield yields represented by yield to worst. An investor cannot invest directly in an index or directly in these types of underlying corporate loans.
*Yields are hypothetical and based upon historical data forecasts. There can be no assurances that any target return objectives will be met. Assumes pricing of LIBOR +400–450, 2.0% 1-Mo. LIBOR, 98–99 OID for middle market (MM) senior loans; LIBOR +500–700, 2.0% 1 Mo. LIBOR, 98–99 OID (Original Issue Discount) for MM unitranche and Libor +650–800, 2.0% 1-Mo. LIBOR, 98–99 OID for MM second lien. Assumes a 3-year average life.
Source: Bloomberg, Bloomberg Barclays, St. Louis Federal Reserve, S&P/Loan Syndication & Trading Association (LSTA), Thomason Reuters LPC and AllianceBernstein (AB)