Insurance Midyear Outlook: Finding Value in Tight Markets

Jul 29, 2026
7 min read
A multifaceted perspective is critical for a full understanding of opportunity and risk.
 
At the halfway point of 2026, resilient growth, persistent risks and tight spreads complicate insurance portfolio decisions. As macro paths diverge and capital standards evolve, we think insurers need to look beyond broad asset-class labels—focusing on collateral quality, liquidity, cash-flow variability and segments where valuations still compensate for risk.
 

A Resilient Global Economy, but Keep a Close Eye on Downside Risks

 
The global economy has held up fairly well to this point, but the downside risks have increased. Higher oil prices from the Middle East conflict could keep inflation elevated, while softer growth could push monetary policies in different directions as central bank mandates diverge.
 
Geopolitics and AI adoption are key variables. A quick resolution in Iran could ease oil prices, while a prolonged shock would risk disrupting a macro landscape that’s more fragile than in 2022. AI-driven productivity gains could support growth without stoking inflation but might also cost jobs. And there’s a risk that AI’s outcomes may not justify heavy capital spending.
 
In the US, a decline in interest rates may be in order, because risks seem to be skewed more toward growth and financial conditions than core inflation. Ten-year Treasury yields are still above their 2022 levels when inflation was 9%, and the yield curve remains dislocated, with much higher yields than we would expect, particularly at shorter maturities. In Europe, the starting point is very different from the severe disruption of 2022. Today, inflation has cooled, policy has evolved from ultraloose to restrictive/neutral and gas prices are much lower.
 

Surveying the Insurance Industry Balance Sheet

 
With relative value harder to come by, insurers are looking for creative balance-sheet solutions. We still see residential real estate as attractive for insurers that can manage cash-flow variability. When assessing opportunities, we believe that a holistic approach across public and private markets makes sense. Insurers should keep asset duration aligned with liabilities, and asset-liability management will likely become more important in Asia as capital standards tighten.
 
On the liability side, North American annuity sales—especially RILAs and traditional VAs—surged in 2025, supported by strong equity markets. As of the first quarter of 2026, annuity sales were more flat, with continued strong growth in variable annuities more than offset by declines in fixed annuity sales. Spread lending through the Federal Home Loan Banks (FHLBanks) and funding agreement–backed notes (FABN) has supplemented income, though it’s drawing NAIC and rating-agency scrutiny. In the UK, high rates could sustain annuity demand into 2026, while in Europe, property and casualty profits should remain solid, despite claims inflation and higher reinsurance costs. China’s life insurance premiums are expected to grow substantially through 2029.
 
We expect insurers to continue exploring alternative capital sources. Sidecar activity has grown, and capital is flowing into partnerships, with asset managers offering differentiated origination and tailored asset-focused solutions. We expect more sidecar volumes from Asia-focused liabilities to continue.
 
An assessment of insurance portfolio construction, in our view, is well served by considering four collateral risk buckets—corporate, commercial real estate, residential real estate and consumer (Display), as well as five key risks, which we’ll assess next.
Asset Risk and Value Matrix Through an Insurance Lens
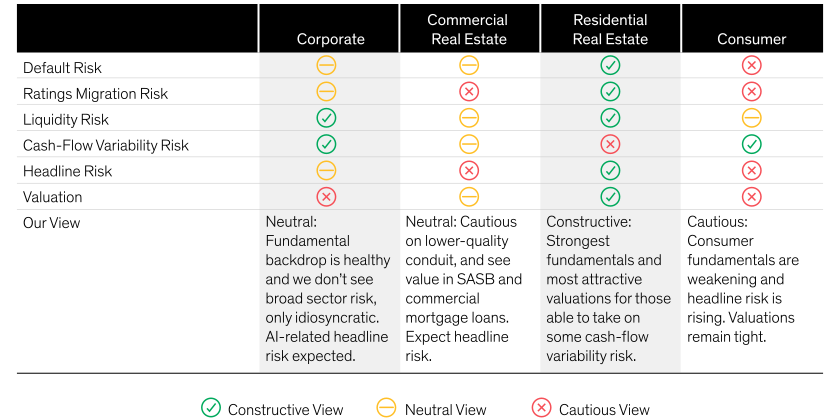
A current assessment of the prospects for four key collateral types

Current analysis does not guarantee future results.
SASB: single asset single borrower
As of June 30, 2026
Source: AllianceBernstein (AB)

Default Risk Low, but Sector Distinctions Emerging

While default risk remains relatively muted (Display), the next phase will likely see variations across sectors. We’re neutral toward corporate credit: speculative-grade defaults were elevated in 2025, but have declined as expected, as companies’ balance sheets stabilize and pressure to refinance becomes more manageable.

Default Risk: Still Low, with Room to Go Higher
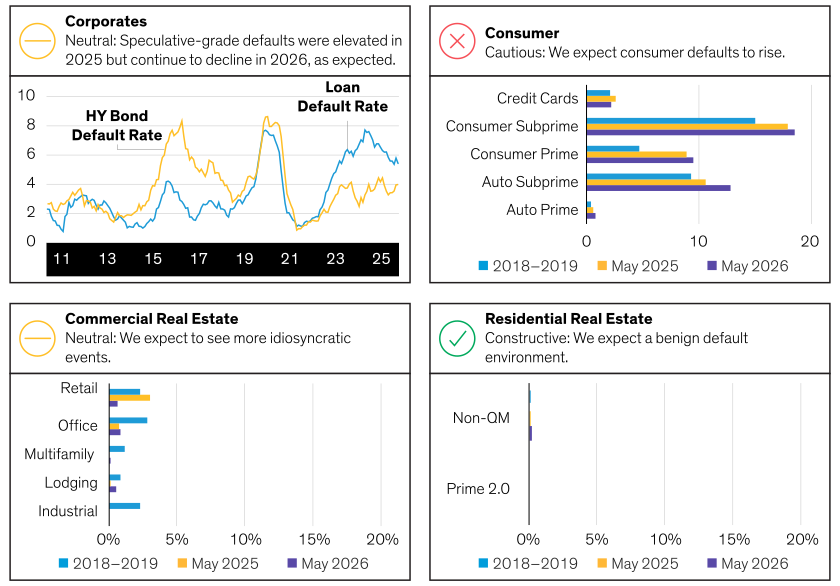
An assessment of the current default prospects across four key collateral types

Current analysis does not guarantee future results.
QM: qualifying mortgage. Consumer default rate is based on the most recent month of data.
As of May 31, 2026
Source: Barclays, Citi, Moody’s and AB

Our overall assessment of commercial real estate is also neutral, but risks will likely be more deal-specific, not a broad default cycle. In comparison, consumer credit seems more vulnerable. Defaults are likely headed upward as household fundamentals weaken and pressure builds across lower-income cohorts. Given this, our view has shifted from favorable to selective.

Residential real estate stands apart as relatively favorable. Defaults are benign and housing fundamentals provide support: home prices are still rising, existing inventory is still historically low and household equity has risen to record highs. Some regional markets are starting to show pressure, so there are risks, but the broad backdrop seems relatively healthy.

Rating Migration Risk: Outcomes Likely Nuanced

We don’t see a broad decline in credit ratings—the outcomes will likely be more nuanced (Display). US corporate fallen angels outpaced rising stars in 2025, but investment-grade ratings are broadly migrating upwards, elevating overall index quality. Our outlook for more ratings pressure in 2026 has seen mixed results. Corporate and commercial mortgage-backed securities (CMBS) migration has held up better than expected, though we see pockets of vulnerability.

Rating Migration Risk: We Expect Winners and Losers
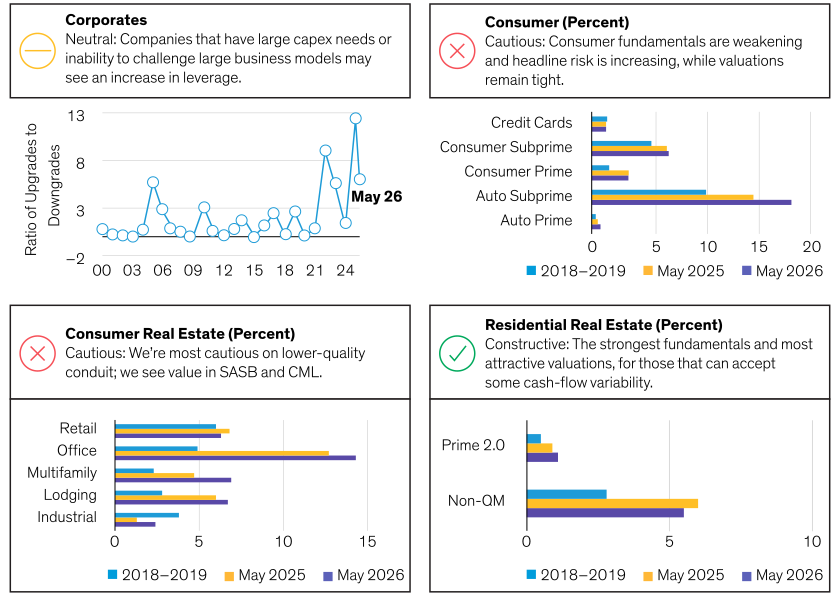
An assessment of the current rating migration risks across four key collateral types

Current analysis does not guarantee future results.
As of May 31, 2026
CML: commercial mortgage loan. Consumer default rate is based on the most recent month of data.
Source: Barclays, Citi Research, Moody’s and AB

We remain neutral on corporate credit overall, but firms with large AI-related capex needs, excess leverage or business models susceptible to disruption could see leverage and ratings pressure rise. Also, issuance from AI hyperscalers could lead to a supply glut. Consumer credit looks more challenged: fundamentals are softer, headline risk is climbing and valuations are tight, and headwinds remain from a cloudy trade picture and tariff pressures on consumer products.

In commercial real estate, we’re most cautious on lower-quality conduit exposure, but see value in SASB transactions and CML. Residential real estate maintains the most robust fundamentals, with attractive valuations for investors who can take on variable cash flows. Overall, we expect upgrade and downgrade trends to normalize, with issuer-specific factors driving outcomes more so than broad deterioration.

Scenario Testing Cash-Flow Variability Risk

Interest rates have remained volatile in 2026, so it’s critical to test cash flows under multiple scenarios (Display) for highly rate-sensitive sectors (Display). Also, assets are emerging with structural features containing options to refinance or extend from their original expected weighted-average life, and they’re taking share from traditional assets with bulleted maturities. To assess their rate variability, investors should evaluate both rate and spread changes. In our view, the right tool is key in analyzing cash-flow variability correlation across assets—and versus the liabilities from an insurer’s products.

Cash-Flow Variability: Connecting the Dots
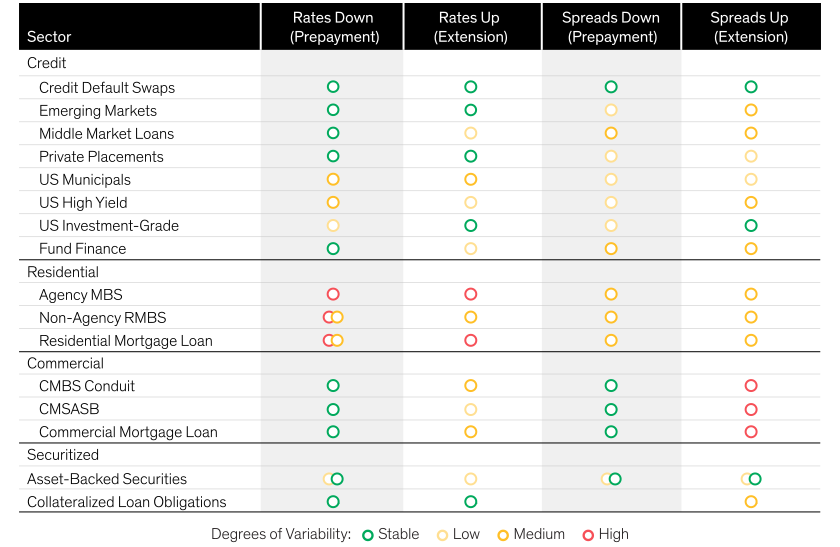
An assessment of how much cash flows vary across four key collateral types and subtypes

Current analysis does not guarantee future results.
MBS: Mortgage-Backed Security; RMBS: Residential Mortgage-Backed Security.
As of June 30, 2026
Source: AB

Liquidity Risk: How Liquid Is “Liquid” Under Stress?

Bonds still dominate insurers’ asset allocations, but their liquidity profile has changed. In aggregate, allocations have declined, with US life insurance allocations falling from about 76% to 70% over the past decade. Exposure to private bonds has increased, which could make portfolios less flexible when markets are stressed or rapid rebalancing is necessary.

A key question for investors to consider is how liquid “liquid” bonds actually are under stress (Display). Illiquidity premiums tend to widen in volatile markets: there was a five-basis-point gap between the high- and low-liquidity buckets in April 2025 versus March 2026. In this environment, high-quality short-term asset-backed securities, along with tools such as FHLBanks, Farmer Mac, FABN issuance and commercial paper, may help enhance liquidity. We also think it’s increasingly important to keep a short list of potential sell candidates and regularly reassess liquidity premiums as market structures evolve.

How Liquid Are Liquid Bonds?
US Investment-Grade Corporate Bond Market Liquidity Profile
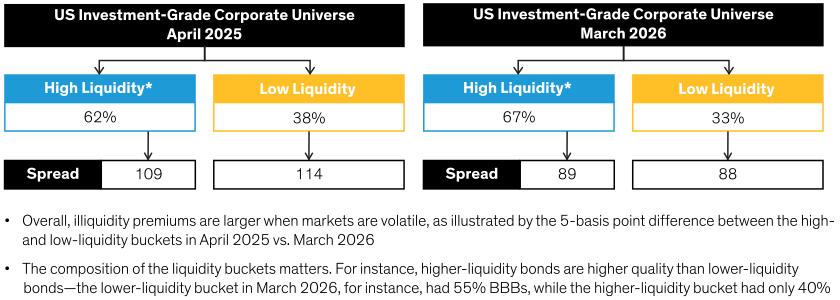
US investment grade corporate bond liquidity profile: April 2025 vs. March 2026

Current analysis does not guarantee future results.
The US investment-grade corporate universe is represented by the Bloomberg US Corporate Bond Index. High- and low-liquidity buckets were informed by AB’s proprietary liquidity aggregation tool, ALFA, which compiles fixed-income trading data from external providers into organized real-time views of bond market liquidity.
As of March 31, 2026
Source: Bloomberg and AB

Taking Stock of the Current Headline Risks

Despite recent negative headlines around private credit, robust demand is still expected even if  insurance demand moderates; some investor cohorts, including defined contribution plans, remain relatively underinvested. Headlines have mainly centered on the middle market direct lending segment of private credit, with defaults largely in below-investment grade loans that are less traveled by insurers.

We’re also monitoring risks from the K-shaped US economy, where higher gas prices could widen the divide. Income growth is slowing except for the highest earners—the top part of the “K.” That cohort drives about half of consumer spending and private investment in tech. They drove economic growth in 2025 and could remain a key force, though non-unionized white-collar jobs are most at risk from AI.

Valuations: Where Spreads and Structure Are Appealing

The most compelling opportunities today seem to be in residential and consumer risk. In Europe, the revised Solvency II framework is expected to make capital charges more risk-sensitive, with greater distinctions by tranche seniority, credit quality and duration. That should reduce the capital burden in some areas and make select securitized assets more attractive relative to corporate credit.

Collateralized loan obligations (CLOs) are a good example of where structure can help investors. We’re cautions on underlying loans given higher defaults, but CLOs offer a resilient structure and compelling spread versus US corporate bonds. Agency MBS also seem to deserve a place in allocations. Despite recent outperformance, spreads still look attractive versus investment-grade corporates, and banks, non-US investors and government sponsored enterprises could support demand. More broadly, residential credit sectors offer a spread over US corporates.

Market resilience can create opportunity, even as risks vary across sectors. With spreads tight, insurers may benefit from being more selective in taking risk. We think careful collateral analysis, liquidity planning and liability alignment can help uncover attractive opportunities in a complex market.

The views expressed herein do not constitute research, investment advice or trade recommendations, do not necessarily represent the views of all AB portfolio-management teams and are subject to change over time.


About the Authors