US Corporate Cash Is Down

Should Investors Worry?

July 23, 2019
3 min read

The recent decline in US corporate cash hasn’t raised a lot of eyebrows, but it has caused one of our equity-quality indicators to flash a warning. Since equity quality is one of the signals with a strong track record of predicting market sell-offs, should investors be worried?

According to Moody’s, US corporations’ cash holdings fell to a three-year low of $1.685 trillion in 2018. That cash was deployed in many different ways, but the overall decline triggered one of the signals that we use to track equity quality. As we’ve discussed, equity quality is one of four indicators that monitor the potential for an equity market sell-off.

Three Signals for Equity Quality

Of course, there are many ways to assess the underlying quality of corporate balance sheets, but we believe that three indicators do an effective job of highlighting conditions that suggest either deterioration or improvement in balance-sheet health:

1.Net debt issuance, which is new loans to corporations combined with changes in cash holdings

2.Net equity issuance, which aggregates equity capital raised offset by stock buybacks

3.Capital expenditures relative to depreciation and amortization

If any of these signals is unusually high, it could be a bearish sign for equity markets. The rationale boils down to an intuitive notion: corporate excess. As economic cycles advance, businesses tend to become overly optimistic. They’re prone to expect unreasonably high demand, and they respond by building excess capacity (funded by debt or equity capital), only to see demand eventually fall short. The technology, media and telecom bubble in the late 1990s is a classic example of overextension.

Corporations Don’t Seem to Be Overindulging

So, an elevated net debt signal (Display) could be one sign of overextended corporate balance sheets. But it requires a fundamental assessment to understand not only what’s driving the net debt change but the motivations behind it and how it relates to the other two pieces of the equity-quality puzzle.

Net-Debt Issuance Indicator Is Flashing a Warning

Z Scores for Equity-Quality Indicators

Net-Debt Issuance Indicator Is Flashing a Warning

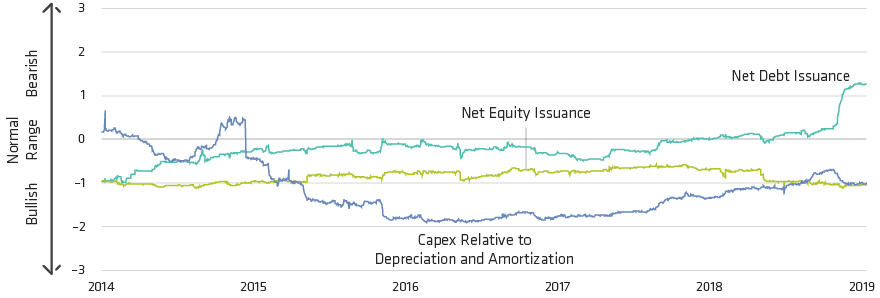
Data presented as z scores, a standardized measure that indicates how many standard deviations an indicator is from the mean. Higher z scores indicate a bearish signal while lower z scores indicate a bullish signal. Net equity issuance equals the change in common shares outstanding, the log of (common shares outstanding (t)/common shares outstanding (t–1)). Net debt issuance equals the change in (total debt minus cash) divided by average total assets. Total debt equals long-term debt plus debt in current liabilities plus preferred stock capital plus noncontrolling interest. Cash equals cash plus short-term investments.
As of July 11, 2019
Source: S&P Compustat and AllianceBernstein (AB)

The elevated net debt signal has been primarily driven by a decline in cash balances. Rather than feeding corporate excess, much of the cash seems to have gone to share buybacks, which return cash to shareholders—a shareholder-friendly activity. This assessment is supported by improvement in the net equity issuance indicator. A key contributor to the recent rise in buybacks was the repatriation of cash by US multinationals taking advantage of the 2017 US tax reform.

What about the third indicator: capital spending relative to depreciation and amortization?

The intuition behind this signal: businesses that spend too much on capital projects relative to replenishing or replacing aging equipment are overreaching. Right now, this signal isn’t in bearish territory, either. In fact, business investment as a percentage of corporate cash has been in secular decline since the mid-1980s, a trend that has continued over the recent cycle (Display).

Trends in Corporate Cash Usage

Percent of Gross Cash Flow (Three-Year Rolling Average)
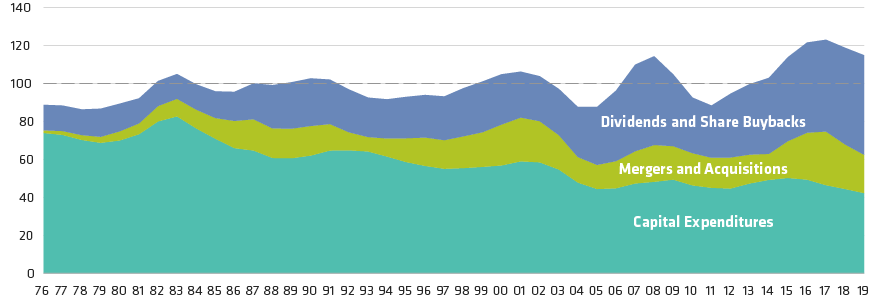
Trends in Corporate Cash Usage

As of June 30, 2019
Source: FactSet and AllianceBernstein (AB)

Instead, cash has been returned to shareholders. The capital spending discipline exercised by corporations would be supportive of pricing power and sustainability of margins and would indicate longer, shallower cycles.

Equity-Quality Indicators Still Bear Watching

There’s one more reason investors shouldn’t be too concerned about the decline in corporate cash: the cycle isn’t over yet. It’s unlikely to end as long as the central bank “put”—the backstop of supportive monetary policy—is in place. From our view, it would take an uncomfortable rise in inflation or an assessment by the market that the Fed has run out of ammunition to change the policy.

However, investors should continue to look closely at equity quality. It has been relatively steady for the last few years, as balance sheets have been strong and behavior has been shareholder-friendly and conservative. But lower cash balances do reduce corporations’ cushion somewhat. If net debt issuance continues to rise from firms taking on more debt, or if capital spending relative to depreciation and amortization becomes unusually high, it could leave businesses more vulnerable in a slowdown.

The views expressed herein do not constitute research, investment advice or trade recommendations and do not necessarily represent the views of all AB portfolio-management teams.


About the Authors