FANG Stocks Expose Blind Spots in Risk Models

13 September 2017
4 min read

The investing industry is constantly devising new acronyms and buzzwords. Sometimes these can be dangerous. The rise of the FANG stocks highlights how clusters of stocks may create investing hazards that standard risk models struggle to detect.

Equity investors rely on various risk models to protect portfolios from a range of threats. Standard models generally focus on factors that affect performance, such as style, sector, country and currency. These models are designed to make sure that an investor is aware of a portfolio’s exposures and can avoid being too heavily tied to particular areas of the market.

But fundamental risk models track only a defined set of risks. There are countless hazards to investing portfolios that slip under their radar screens. In particular, we think investors should pay more attention to cluster risk. This is the risk that performance patterns of a group of stocks with similar business profiles but different risk classifications become correlated.

Rise of the FANGs

US mega-cap technology stocks are an excellent example. Over the past two years, Facebook, Amazon.com, Netflix and Google have become known collectively as the FANG stocks, a group of companies dominating the transformation of media and consumer markets through technology. More recently, Apple has been added to the group, which is now known as the FAANGs.

These companies have a combined market cap of $2.6 trillion, or nearly 11% of the S&P 500 Index market capitalization. From January 1 through August 31, they accounted for more than a quarter of the S&P 500’s gains. And they’ve generated ongoing debate about whether a bubble is developing in technology stocks.

This is where the problems begin. Although technology drives the businesses of all five companies, they aren’t all classified as technology stocks by risk models. According to MSCI’s Global Industry Classification Standard (GICS), Facebook, Google and Apple are information technology companies, while Amazon.com and Netflix are in the consumer-discretionary sector.

Unintended Risks Matter

Taxonomy is more than just a technicality. Standard risk models might check that a portfolio doesn’t have too much exposure to the technology sector or the consumer sector. But they don’t look at the FANG or FAANG groups as a whole. And if the performance of these stocks is correlated, a portfolio that holds too much of the group might face unwanted risks.

In fact, we believe the group’s stock returns have become increasingly correlated. Over the past two years, the term “FANG” became popularized, as indicated by Google trends search data (Display, left). Meanwhile, stock-specific returns for the group have increasingly moved in step (Display, right). We calculate stock-specific returns by taking the stock’s actual return and subtracting the influence of factor returns.

Fang Stocks Returns Have Become Increasingly Correlated

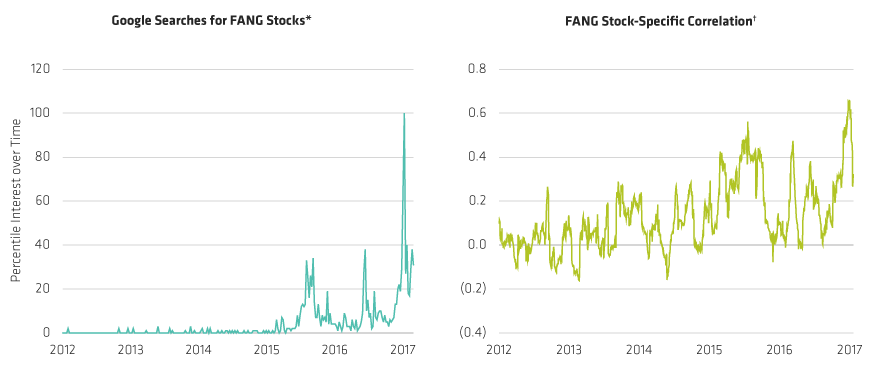
Ledt chart through July 30, 2017. Right chart through July 28, 2017.
*Numbers represent search interest relative to the highest point on the chart for the given region and time. A value of 100 is the peak popularity for the term. Avalue of 50 means that the term is half as popular.
Likewise a score of 0 means the term was less than 1% as popular as the peak.
✝Average pairwise 30-day correlation in US-dollar terms of stock-specific return. Stock-specific return is the actual return minus the factor return.
Source: FactSet, Google, MSCI, Risk Model:Barra GEMLT (Stable) and AB

Looking at specific trading days reveals how this correlation has intensified. For example, on March 8, 2016, equity factor returns were negative for all five FAANG stocks. Yet the stock-specific return for each stock was positive (Display). In our view, this indicates that the returns of this group of stocks are marching to their own beat—and in contrast to expectations.

FAANG Stock Correlation has Overwhelmed Factors
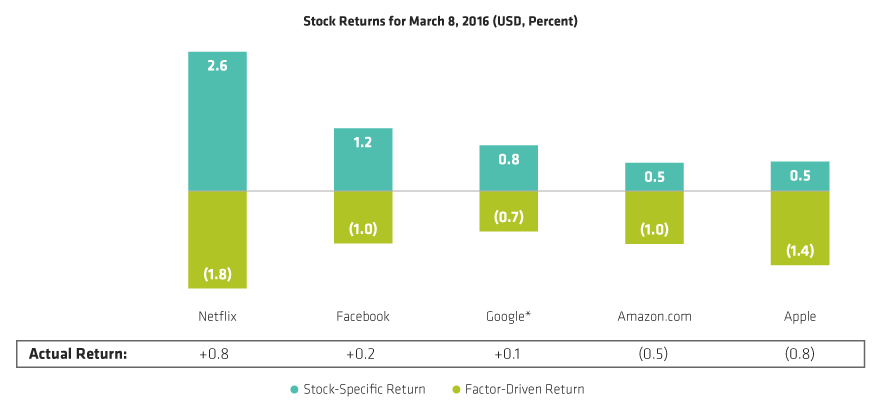
*Alphabet, Inc.
Stock-specific return is the actual return minus the factor return.
Source: MSCI, FactSet, Risk Model: BARRA GEMLT (Stable) and AB

Why does this matter for investors? Because a risk model that isn’t aware of this correlation may prompt a portfolio manager to purchase all five FAANG stocks—a position that could be vulnerable to a sharp downturn of the group. Or, the risk model may suggest adding to positions in Netflix or Amazon.com without considering the possibility that these positions may suffer if Apple has a bad day.

Cluster Risks: From Financials to Healthcare

Cluster risks can develop in different sectors. In financials, major credit card companies, including American Express, MasterCard and Visa, are classified by standard risk models in multiple industry groups, including financials, credit cards, information technology and software. So a portfolio with large positions in all three companies might not trigger standard risk alarms.

CVS Health, the US drugstore chain, is classified by GICS as a consumer staples company. Express Scripts, the pharmaceutical supplier, is in healthcare. Yet both companies derive most of their revenue from pharmaceuticals benefits management, which creates a potential risk in a portfolio with positions in both stocks.

Ask the Right Risk Questions

These examples illustrate how hidden risks may evade sophisticated risk radars. We’re not suggesting that investors abandon standard risk models. But we do think that robust risk control requires asking the right questions—and applying fundamental logic to a quantitative process.

When done correctly, investors can gain comfort that knowing that a single cluster of stocks isn’t driving too much portfolio risk. And when clusters are identified, portfolio managers should aim to limit positions accordingly. Isolating unintended risks can help ensure that stock-specific risk is the biggest return driver in core equity portfolios.

The views expressed herein do not constitute research, investment advice or trade recommendations and do not necessarily represent the views of all AB portfolio-management teams. AllianceBernstein Limited is authorised and regulated by the Financial Conduct Authority in the United Kingdom.

MSCI makes no express or implied warranties or representations, and shall have no liability whatsoever with respect to any MSCI data contained herein.
The MSCI data may not be further redistributed or used as a basis for other indices or any securities or financial products. This report is not approved, reviewed or produced by MSCI.


About the Authors