-
The views expressed herein do not constitute research, investment advice or trade recommendations and do not necessarily represent the views of all AB portfolio-management teams.
Portfolio Risk Management
A Multidimensional Perspective
September 23 2019
10 min read
Portfolio Risk-Management Tools
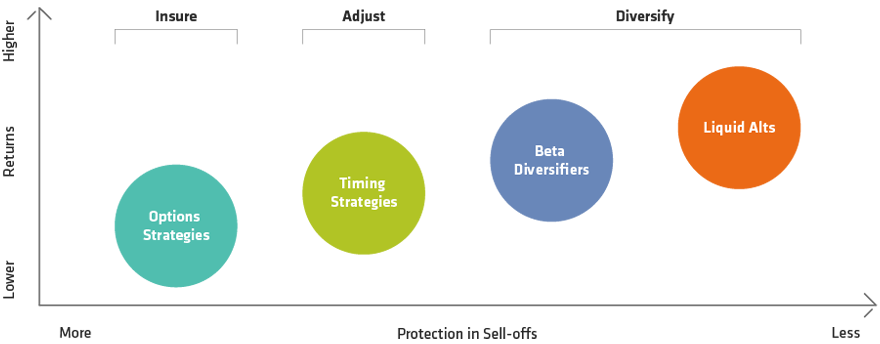
Source: AllianceBernstein (AB)
How Do Risk-Management Tools Fare When Equities Falter?
Return of Tools by Equity Performance Decile
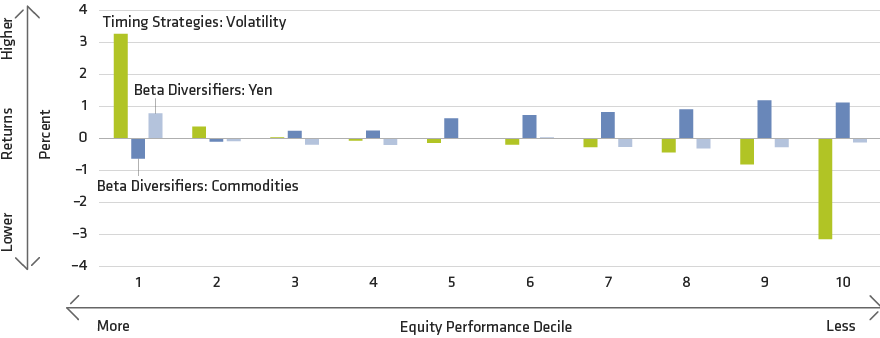
Through June 28, 2019
Timing Equity Using Volatility represents the return of a strategy that takes long or short developed equity market positions based on volatility. If volatility is higher than usual, the strategy shorts equity, and vice versa. Volatility is measured by a proprietary risk model. Results are based on simulated daily returns from December 9, 1971, through June 28, 2019. Commodities are based on the Bloomberg Commodity Index starting in 1991 and on AB data prior to 1991. Returns are from December 6, 1971, through June 28, 2019. Yen is based on the simulated return of a constant three-month forward Yen/Dollar forward contract—they include spot currency movements and carry. Yen returns are from September 1, 1978, through June 28, 2019. Equity return deciles are based on developed-market daily excess returns from December 6, 1971, to June 28, 2019.
Source: Bloomberg and AllianceBernstein (AB)
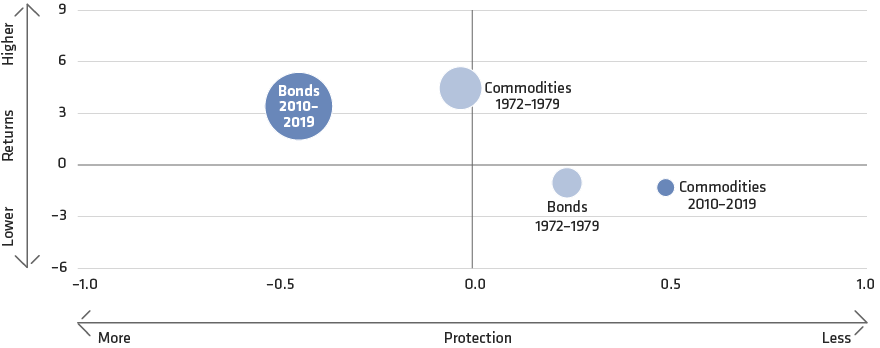
Risk-Management Tools: A Historical Perspective
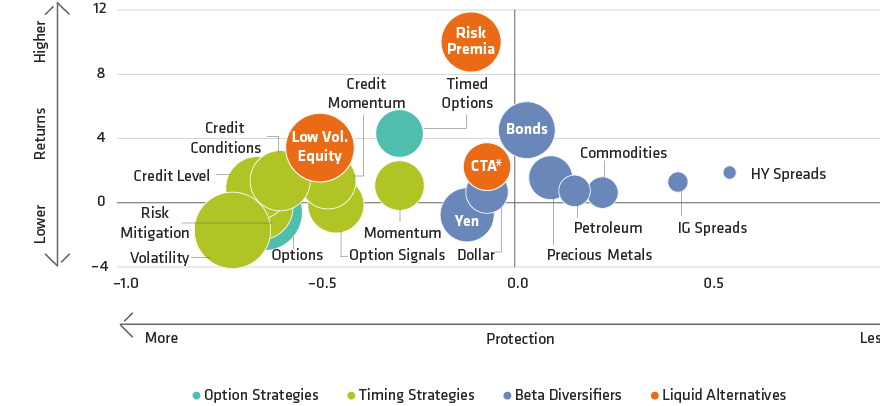
Through June 28, 2019
Protection is measured by the correlation of a tool to developed market equity excess returns, using overlapping five-day returns starting from December 6, 1971, or the start date of the underlying strategy, whichever is later, through June 28, 2019. Return represents a proprietary risk-adjusted return score that incorporates effectiveness, reliability and length of history. The score equals the average of the full-period and five-year half-life weighted decay-weighted Sharpe ratio divided by the standard error of the rolling six-month Sharpe ratio. The size of the circles is proportional to the hit rate of protection—the percentage of days that the strategy produced positive returns when equity market excess returns were lower than –1%.
*CTA denotes Commodity Trading Advisors, a strategy that invests in financial assets based on their historical trends. It is represented by the NEIXCTAT Index of 10 equal-weighted trend-following CTAs
Source: AllianceBernstein (AB)
A Closer Look at Timing Strategies
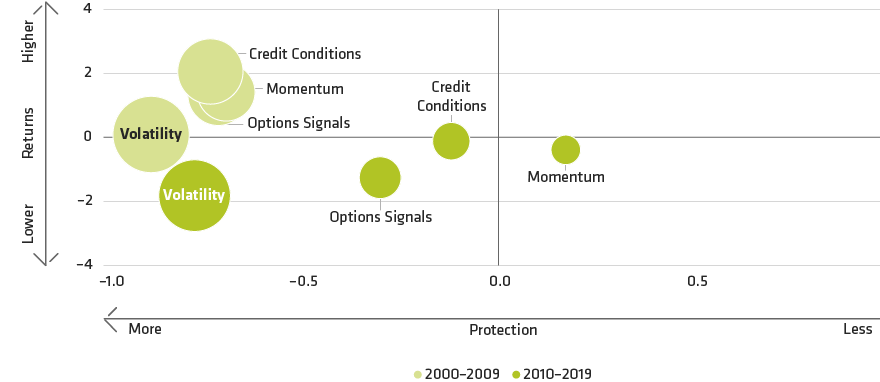
Through June 28, 2019
Protection is measured by the correlation of a tool to developed-market equity excess returns, using overlapping five-day returns starting from December 6, 1971, or the start date of the underlying strategy, whichever is later, through June 28, 2019. Return represents a proprietary risk-adjusted return score that incorporates effectiveness, reliability and length of history. The score equals the average of the full-period and five-year half-life weighted decay-weighted Sharpe ratio divided by the standard error of the rolling six-month Sharpe ratio. The size of the circles is proportional to the hit rate of protection—the percentage of days that the strategy produced positive returns when equity market excess returns were lower than –1%.
Source: AllianceBernstein (AB)
A Closer Look at Beta Diversifiers
Through June 28, 2019
Protection is measured by the correlation of a tool to developed-market equity excess returns, using overlapping five-day returns starting from December 6, 1971, or the start date of the underlying strategy, whichever is later, through June 28, 2019. Return represents a proprietary risk-adjusted return score that incorporates effectiveness, reliability and length of history. The score equals the average of the full-period and five-year half-life weighted decay-weighted Sharpe ratio divided by the standard error of the rolling six-month Sharpe ratio. The size of the circles is proportional to the hit rate of protection—the percentage of days that the strategy produced positive returns when equity market excess returns were lower than –1%.
Source: AllianceBernstein (AB)
About the Authors