
Can Active High-Yield ETFs Help Build a Better Path for Portfolios?
Key Takeaways:
- The high-yield asset class can be an effective building block for investors seeking reliable income across changing markets.
- Historically, it has delivered equity-like returns with just over half the risk, with much shallower declines and faster recoveries in equity downturns, which we believe makes it a “better beta.” ¹
- Active management may improve risk-adjusted returns versus passive funds. The AB High Yield ETF (NYSE: HYFI) emphasizes security selection, dynamic beta management and a disciplined investment process in a flexible vehicle.
Returns across wide-ranging asset classes may be more moderate than in the past. We believe investors can improve the path of portfolio returns through better up/down capture—aiming to capture the upside of rising markets while giving up less ground in down markets. And they can take concrete steps to build this better path by incorporating what we view as “better betas.”
High Yield’s Credentials as a Better Beta
Betas are the fundamental market exposures that act as portfolio building blocks. But not all betas are alike—some have attributes and behaviors that may help investors design portfolios that improve the path of returns over time. We think high yield is one of those building blocks. It offers reliable income from payments that are contractually obligated, and its return characteristics are attractive.
The high-yield asset class lives in the bond world, but because high-yield bonds are driven more by economic growth and corporate profits, they’ve historically generated equity-like annualized returns. The asset class has been able to deliver that performance with just over half the risk of stocks. What’s more, high yield’s steady income payments have provided a cushion during equity market selloffs.
On average, the S&P 500 has lost 32% during large equity selloffs; high yield’s decline has been less than half that amount, at 14% (Display). High-yield bonds have also tended to rebound faster than stocks from downturns. Since 1990, when the S&P 500 has fallen by more than 10%, it has needed an average of 15 months to regain that lost ground. High yield has recovered fully in just six months.
With reliable income and strong characteristics, the high-yield asset class has produced attractive risk-adjusted returns. Since 1990, the Bloomberg US High Yield Index, 2% Constrained, has delivered a 1.17 Sharpe Ratio versus 1.06 for the S&P 500. We think that makes it an effective portfolio building block.

Past performance and historical analysis do not guarantee future results. Individuals cannot invest directly in an index.
High-yield index represented by Bloomberg US Corporate High Yield Index. Short-duration high-yield index represented by Bloomberg US 1–5 Year High Yield Index
Right display: Large drawdown periods defined as S&P 500 total return index peak to trough: dot-com bubble (September 1, 2000–October 9, 2002), global financial crisis (October 9, 2007–March 9, 2009), commodity crisis (July 17, 2015–February 11, 2016), COVID-19 (February 19, 2020–March 20, 2020), 2022 hiking cycle (January 3, 2022–October 12, 2022) and tariff concerns (February 18, 2025–April 8, 2025). Right display: Beta measured as the historical performance deviation of S&P 500 daily returns relative to the Bloomberg US Corporate High Yield Index over a six-month rolling period.
As of March 31, 2026.
Source: Bloomberg, Morningstar, S&P and AllianceBernstein (AB)
Targeted Alpha Matters, Too: The AB High Yield ETF
Beyond the beta aspect, active management offers the potential for targeted alpha opportunities. In the high-yield world, defaults are a drag on portfolio returns, so avoiding them has historically done more for outperformance than finding winners. Because passive strategies mirror benchmarks, they may magnify exposure to companies with poor fundamentals.
Actively managed strategies, in contrast, use research to invest selectively in high-conviction opportunities and spot warning signs of deteriorating credit quality. Since the start of 2014, the actively managed AB High Yield ETF (NYSE: HYFI) has avoided over 70% of the defaults in the high-yield market.
HYFI seeks to provide income by emphasizing security selection, dynamic beta management to capture upside alpha and reduce downside risk, and a disciplined investment process that combines quantitative and fundamental research as well as both top-down and bottom-up analysis. The fund has consistently outperformed both passive and active peers in the US high-yield space (Display).
Alpha can come from non-investment sources, too, including the ETF vehicle. ETFs’ liquidity makes it easier to reshape portfolio exposures, and transparency enables effective monitoring and management of risks. Active ETFs also have lower expense ratios than traditional funds, which may reduce fee drag.
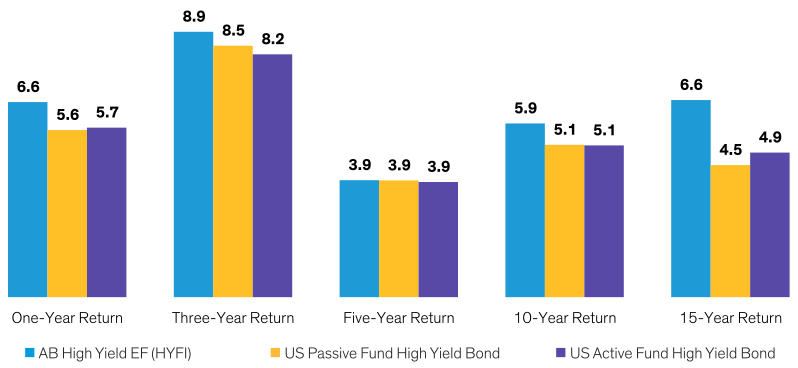
Past performance does not guarantee future results.
ETF: exchange-traded fund. HYFI was incepted on May 20, 2005. The active category average is based on the US Active Fund High Yield Bond Morningstar category. The passive category average is based on the US Passive Fund High Yield Bond Morningstar category. HYFI was converted on May 15, 2023, from its predecessor fund, AB High Yield, which was incepted on May 20, 2005. Common inception is defined as May 1, 2007.
As of June 30, 2026
Source: Bloomberg, Morningstar and AB
Past performance does not guarantee future results. Current performance may be lower or higher than the performance information shown. The investment return and principal value of an investment in the Fund will fluctuate, so that shares, when redeemed, may be worth more or less than their original cost. Performance assumes reinvestment of distributions and does not account for taxes. Please visit the HYFI fund page for performance current to the most recent month-end and standardized performance.
How to Take Action
The Morningstar Rating™ for funds, or star rating, is calculated for managed products (including mutual funds, variable annuity and variable life subaccounts, exchange-traded funds, closed-end funds, and separate accounts) with at least a three-year history. Exchange-traded funds and open-ended mutual funds are considered a single population for comparative purposes. The star rating is calculated based on a Morningstar Risk-Adjusted Return measure that accounts for variation in a managed product’s monthly excess performance, placing more emphasis on downward variations and rewarding consistent performance. The Morningstar Rating does not include any adjustment for sales loads. The top 10.0% of products in each product category receive 5 stars, the next 22.5% receive 4 stars, the next 35.0% receive 3 stars, the next 22.5% receive 2 stars and the bottom 10.0% receive 1 star. The Overall Morningstar Rating™ for a managed product is derived from a weighted average of the performance figures associated with its three-, five- and 10-year (if applicable) Morningstar Rating metrics. The weights are: 100% three-year rating for 36–59 months of total returns, 60% five-year rating/40% three-year rating for 60–119 months of total returns and 50% 10-year rating/30% five-year rating/20% three-year rating for 120 or more months of total returns. While the 10-year overall star rating formula seems to give the most weight to the 10-year period, the most recent three-year period actually has the greatest impact because it is included in all three rating period.
Investing in ETFs involves risk and there is no guarantee of principal.
Investors should consider the investment objectives, risks, charges and expenses of the Fund/Portfolio carefully before investing. For copies of our prospectus or summary prospectus, which contain this and other information, visit our Literature Center or contact your AB representative. Please read the prospectus and/or summary prospectus carefully before investing.
Shares of the ETF may be bought or sold throughout the day at their market price on the exchange on which they are listed. The market price of an ETF’s shares may be at, above or below the ETF’s net asset value (NAV) and will fluctuate with changes in the NAV as well as supply and demand in the market for the shares. Shares of the ETF may only be redeemed directly with the ETF at NAV by Authorized Participants in very large creation units. There can be no guarantee that an active trading market for the Fund’s shares will develop or be maintained or that their listing will continue or remain unchanged. Buying or selling the Fund’s shares on an exchange may require the payment of brokerage commissions and frequent trading may incur brokerage costs that detract significantly from investment returns.
Alpha measures risk-adjusted excess return over a benchmark
Beta measures the sensitivity of an investment’s returns to movements in the broader market. A beta of 1.0 indicates that the investment has historically moved in line with the market; a beta above or below 1.0 indicates greater or lower sensitivity, respectively.
Historically, the high-yield asset class has delivered equity-like returns with just over half the risk of stocks. It has also declined much less than stocks during equity downturns and recovered much faster (see Display).¹
¹ Source: AllianceBernstein, Bloomberg and S&P. High yield represented by the Bloomberg US Corporate High Yield 2% Issuer Capped Index; equities represented by the S&P 500 Index. As of August 18, 2025. Past performance does not guarantee future results.
Below-Investment-Grade Securities Risk: Investments in fixed-income securities with lower ratings (a.k.a. junk bonds) are subject to a higher probability that an issuer will default or fail to meet its payment obligations. These securities may be subject to greater price volatility due to such factors as specific municipal or corporate developments and negative performance of the junk bond market generally and may be more difficult to trade than other types of securities.
Credit Risk: A bond’s credit rating reflects the issuer’s ability to make timely payments of interest or principal—the lower the rating, the higher the risk of default. If the issuer’s financial strength deteriorates, the issuer’s rating may be lowered, and the bond’s value may decline.
Derivatives Risk: Derivatives may be more sensitive to changes in market conditions and may amplify risks.
Foreign (Non-US) Investment Risk: Investments in securities of non-US issuers may involve more risk than those of US issuers. These securities may fluctuate more widely in price and may be more difficult to trade than domestic securities due to adverse market, economic, political, regulatory or other factors.
Inflation Risk: Prices for goods and services tend to rise over time, which may erode the purchasing power of investments.
Investment Securities Risk: To the extent the Fund invests in other funds, shareholders will bear two layers of asset-based expenses, which could reduce returns.
Leverage Risk: Trying to enhance investment returns by borrowing money or using other leverage transactions such as reverse purchase agreements—magnifies both gains and losses, resulting in greater volatility.
Market Risk: The market values of the portfolio’s holdings rise and fall from day to day, so investments may lose value.
AllianceBernstein L.P. (AB) is the investment Advisor for the Fund.
Distributed by Foreside Fund Services, LLC. Foreside is not affiliated with AllianceBernstein.
Prior to close of business on 5/12/2023, the Fund operated as an open-end mutual fund. The Fund has an identical investment objective and substantially similar investment strategies and investment risk profiles as the predecessor mutual fund. The NAV returns include returns of the Advisor Share Class of the predecessor mutual fund prior to the Fund’s commencement of operations. Performance for the Fund’s Shares has not been adjusted to reflect the Fund’s Shares’ lower expenses than those of the predecessor mutual fund’s Advisor Share Class. Had the predecessor fund been structured as an exchange-traded fund, its performance may have differed. Please refer to the current prospectus for further information. Performance prior to 7/27/16 reflects AB High Yield Portfolio, a series of the AB Pooling Portfolios that was reorganized into the Fund and is the surviving entity in the reorganization. Performance for those periods would have been lower if such accounting survivor had operated at the Fund’s current expense levels. Prior to 4/30/21, the Fund was called AB FlexFee High Yield Portfolio. Data prior to 4/30/21 relates to AB FlexFee High Yield Portfolio.
AL-1002692-2026-09-16